The Relative Skeletal Muscle Index (RSMI) is a clinically validated measure used to assess skeletal muscle mass relative to body height in adults.
Developed by Baumgartner in 1998, the RSMI calculator helps identify low muscle mass, sarcopenia risk, and abnormal body composition by combining skeletal muscle mass with percent body fat categories.
Whether you are a clinician, fitness professional, or health- conscious individual, understanding your RSMI score provides critical insight into muscle health, aging, and long-term physical function.
Relative Skeletal Muscle Index (RSMI) Calculator
Assess your muscle mass health and risk for Sarcopenia using the Baumgartner method.
Enter your measurements to calculate your RSMI status.
Result Title
Key Takeaways
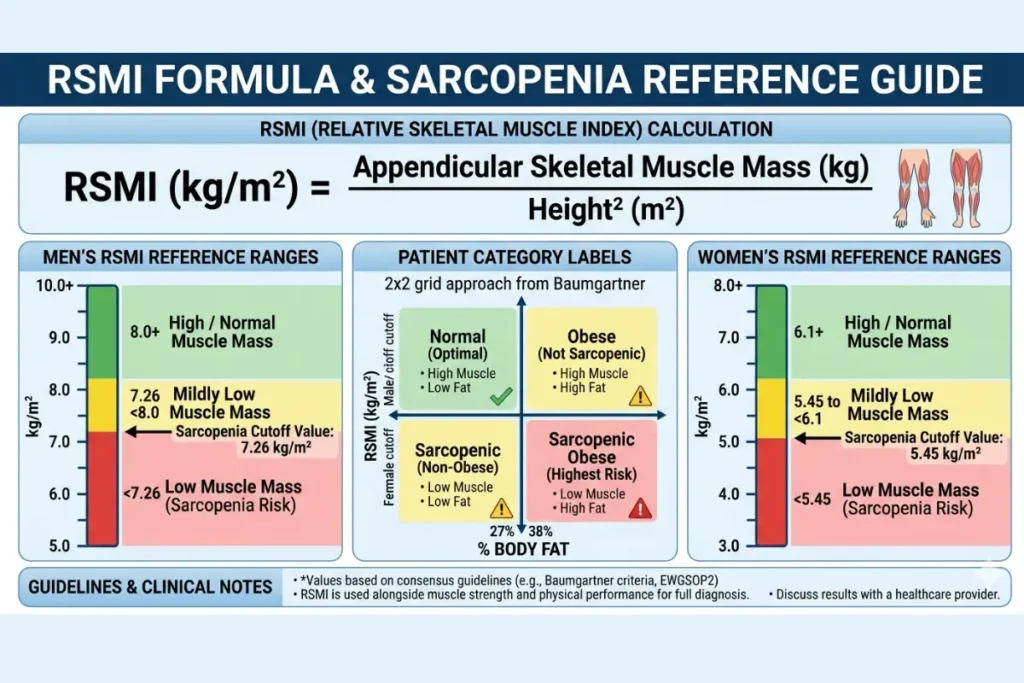
- RSMI = Appendicular Skeletal Muscle Mass (kg) ÷ Height² (m²)
- Normal RSMI: Men ≥ 7.26 kg/m² | Women ≥ 5.45 kg/m²
- Low RSMI is a primary diagnostic marker for sarcopenia
- Body fat percentage combined with RSMI gives a fuller picture of body composition
- The DXA scan is the gold standard for measuring skeletal muscle mass for RSMI
- Sarcopenia affects up to 29% of community-dwelling older adults globally
What Is the Relative Skeletal Muscle Index (RSMI)?
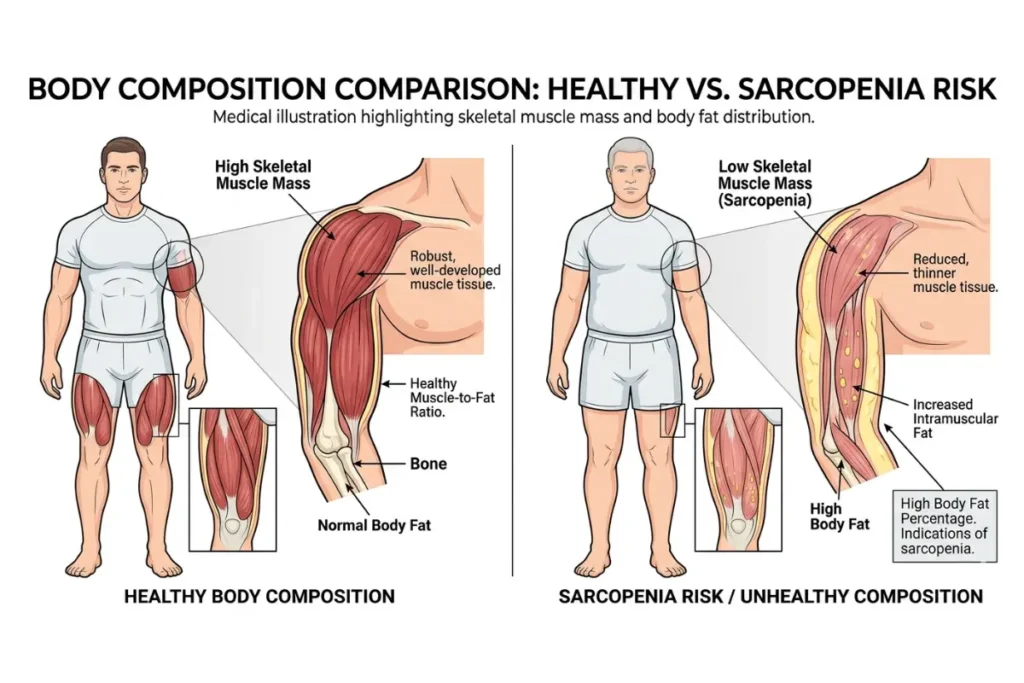
The Relative Skeletal Muscle Index (RSMI) is a body composition measure that indicates the amount of skeletal muscle mass relative to height. Think of it as a muscle-to-height ratio — a simple but powerful number that helps doctors and health professionals understand whether your muscles are healthy for your body size.
Unlike a basic weight or BMI reading, RSMI looks specifically at your skeletal muscle mass — the muscles attached to your bones that you use for every movement, from walking to lifting groceries. This makes it far more useful for spotting muscle loss that total weight measurements simply cannot detect.
Richard N. Baumgartner and colleagues introduced the concept in their landmark 1998 study published in the American Journal of Epidemiology. Their research on adults aged 65 and older in New Mexico showed that low skeletal muscle mass relative to height was directly linked to physical disability, independent of body fat levels.
This was a groundbreaking finding because it proved that muscle loss, not just fat gain, was a silent driver of functional decline in aging adults.
What Is Skeletal Muscle Index?
Skeletal Muscle Index (SMI) is the amount of skeletal muscle mass a person has, expressed relative to their body size — most commonly their height squared. It gives clinicians a standardized way to compare muscle mass across people of different heights and body sizes.
Without this standardization, a tall person would almost always appear to have more muscle than a shorter person simply because of their larger frame. RSMI corrects this by dividing muscle mass by height squared, giving a fair comparison regardless of stature.
What Is the Difference Between Skeletal Muscle Mass and Total Muscle Mass?
Your body has three types of muscle: skeletal, cardiac, and smooth. When we talk about RSMI, we are only measuring skeletal muscle — the voluntary muscles that move your limbs and maintain your posture.
Total muscle mass includes all three types. Skeletal muscle mass focuses only on the muscles you can consciously control. Since skeletal muscle is the largest component of total muscle mass and the most directly linked to physical function, metabolic health, and aging, it is the preferred measurement in RSMI assessment.
RSMI Formula & Skeletal Muscle Index Calculation
The skeletal muscle index formula is straightforward once you understand what each part means.
textRSMI = Appendicular Skeletal Muscle Mass (kg) ÷ Height² (m²)
Let us break this down into simple parts.
Appendicular Skeletal Muscle Mass (ASM) refers to the total skeletal muscle mass in your arms and legs — your appendages. It does not include trunk muscles. Researchers use ASM because it is easier to measure accurately and because limb muscle mass declines faster with age than trunk muscle mass, making it a more sensitive early indicator of muscle loss.
Height² simply means your height in meters, multiplied by itself. For example, if you are 1.70 meters tall, your height² = 1.70 × 1.70 = 2.89 m².
Skeletal Muscle Index Formula – Worked Examples
Example 1 – Adult Male
- Skeletal muscle mass (ASM): 24 kg
- Height: 1.75 m
- Height²: 1.75 × 1.75 = 3.06 m²
- RSMI = 24 ÷ 3.06 = 7.84 kg/m²
- Result: Above the male cutoff of 7.26 kg/m² → Normal
Example 2 – Adult Female
- Skeletal muscle mass (ASM): 14 kg
- Height: 1.62 m
- Height²: 1.62 × 1.62 = 2.62 m²
- RSMI = 14 ÷ 2.62 = 5.34 kg/m²
- Result: Below the female cutoff of 5.45 kg/m² → Low – Sarcopenia Risk
How to Calculate Skeletal Muscle Index Step by Step
Step 1: Get your appendicular skeletal muscle mass measured. The most accurate method is a DXA (Dual-Energy X-ray Absorptiometry) scan. BIA (Bioelectrical Impedance Analysis) devices are a practical alternative.
Step 2: Record your height in meters. If you know your height in centimeters, divide by 100. For example, 170 cm ÷ 100 = 1.70 m.
Step 3: Multiply your height in meters by itself to get height squared. Example: 1.70 × 1.70 = 2.89 m².
Step 4: Divide your skeletal muscle mass by your height squared. Example: 20 kg ÷ 2.89 = 6.92 kg/m².
Step 5: Compare your result to the RSMI normal range for your age and gender. Use the table in the next section to interpret your score.
Use Our Skeletal Muscle Index Calculator
How to Use the RSMI Calculator
Our RSMI calculator is built on the Baumgartner method and is designed to be simple for anyone to use — whether you are a clinician running a geriatric assessment or an individual tracking your body composition.
Here is what you will need to enter:
| Input Field | What to Enter | Where to Get It |
|---|---|---|
| Age | Your age in years | Your records |
| Gender | Male or Female | Self-reported |
| Skeletal Muscle Mass | In kg | DXA scan or BIA |
| Body Height | In cm or meters | Measured height |
| Percent Body Fat | Whole number 0–100 | Body composition test |
Once you click Submit, the calculator will:
- Calculate your RSMI score in kg/m²
- Compare it to gender-specific cutoff values
- Classify your result into one of four patient categories based on your RSMI and body fat percentage
- Flag potential sarcopenia risk if applicable
Who should use this calculator?
- Adults aged 18 and older
- Clinicians assessing patients for sarcopenia or malnutrition
- Fitness professionals tracking client body composition
- Individuals managing age-related muscle loss
- People recovering from illness or surgery, where muscle wasting is a concern
Important: This calculator is a screening tool. It does not replace a clinical diagnosis. Always consult a qualified healthcare provider for medical interpretation of your results.
RSMI Normal Range – What Is a Good Skeletal Muscle Index?
The RSMI normal range was established by Baumgartner and colleagues based on their New Mexico Aging Process Study data. The widely accepted cutoff values for low skeletal muscle mass are:
| Gender | Normal RSMI | Low RSMI (Sarcopenia Risk) |
|---|---|---|
| Men | ≥ 7.26 kg/m² | < 7.26 kg/m² |
| Women | ≥ 5.45 kg/m² | < 5.45 kg/m² |
These cutoffs represent two standard deviations below the mean RSMI of a young reference population — the same statistical approach used to define osteoporosis in bone density testing.
What Is a Good Relative Skeletal Muscle Index?
A good RSMI means your score falls at or above the cutoff for your gender. However, “good” is more nuanced than simply passing the cutoff. Here is a practical interpretation guide:
| RSMI Score (Men) | RSMI Score (Women) | Interpretation |
|---|---|---|
| ≥ 8.50 kg/m² | ≥ 6.50 kg/m² | Excellent muscle mass |
| 7.26–8.49 kg/m² | 5.45–6.49 kg/m² | Normal – healthy range |
| 6.50–7.25 kg/m² | 4.80–5.44 kg/m² | Borderline low – monitor closely |
| < 6.50 kg/m² | < 4.80 kg/m² | Low – high sarcopenia risk |
Higher is generally better, but extremely high RSMI values in older adults should also be reviewed clinically, as they can occasionally reflect measurement error or fluid retention affecting BIA readings.
Relative Skeletal Muscle Index Normal Range for Men vs Women
Women naturally have lower skeletal muscle mass than men. This is driven primarily by differences in testosterone levels, which directly influence muscle protein synthesis. That is why the female cutoff (5.45 kg/m²) is lower than the male cutoff (7.26 kg/m²).
This does not mean women are at a disadvantage, it simply means the reference ranges account for biological differences. A woman scoring 5.80 kg/m² is in the healthy normal range for her gender, even though the same score in a man would indicate low muscle mass.
As people age, RSMI naturally declines. Men lose muscle mass at a rate of approximately 0.5–1% per year after age 50, and this rate accelerates after age 70. Women experience a sharper decline around menopause due to falling estrogen levels, which also plays a protective role in muscle maintenance.
What Is a Good Skeletal Muscle Index?
For most adults, a score above the gender-specific cutoff is considered a good skeletal muscle index. The goal is not just to avoid the low range but to maintain the highest RSMI possible through strength training, adequate protein intake, and an active lifestyle, especially as you age.
Patient Categories Based on Body Fat and Muscle Mass
One of the most clinically useful features of the RSMI assessment is combining your RSMI score with your percent body fat. This creates a four-category classification system that paints a much more complete picture of your metabolic and physical health than either measure alone.
| Category | RSMI | Body Fat | Health Risk |
|---|---|---|---|
| Normal | Normal | Normal | Low risk |
| Sarcopenic | Low | Normal or Low | High functional risk |
| Obese | Normal | High | Metabolic risk |
| Sarcopenic Obesity | Low | High | Highest combined risk |
Sarcopenic Obesity is the most dangerous category. It describes people who appear to have a healthy or even high body weight but have critically low muscle mass hidden beneath excess body fat. Standard BMI measurements completely miss this condition. A person can have a BMI of 27 — technically just overweight, while having severely low RSMI and high visceral fat. Without body composition analysis, this would go undetected.
Research published in the Journal of the American Geriatrics Society found that older adults with sarcopenic obesity had significantly higher rates of disability, cardiovascular disease, and all-cause mortality compared to those with either condition alone.
Should Skeletal Muscle Mass Go Up or Down?
Ideally, skeletal muscle mass should stay stable or increase through adulthood and be preserved as much as possible through older age. Here is the typical trajectory:
- Teens to late 30s: Muscle mass builds, peaks around age 30–35
- 40s to 50s: Gradual decline begins, roughly 3–8% per decade without intervention
- 60s and beyond: Decline accelerates to 1–2% per year without resistance training
The key drivers of unwanted muscle loss include physical inactivity, insufficient protein intake, chronic illness, hormonal changes, and malnutrition. Each of these can push your RSMI score down, increasing sarcopenia risk.
The good news is that resistance exercise and adequate protein intake can reverse early muscle loss at virtually any age. Studies have shown meaningful RSMI improvements in adults well into their 80s with structured exercise programs.
Which Is More Important: Skeletal Muscle or Total Muscle Mass?
Skeletal muscle mass is more clinically important for assessing physical function, metabolic health, and aging-related risk. Here is why:
Skeletal muscle is the primary site of glucose uptake in your body — meaning it plays a major role in blood sugar control. Low skeletal muscle mass is associated with higher insulin resistance, even in people who are not visibly overweight. It is also the tissue most directly responsible for maintaining strength, balance, and mobility.
Total muscle mass, which includes cardiac and smooth muscle, does not offer the same functional insights. That is why RSMI focuses specifically on skeletal muscle, particularly in the arms and legs.
Skeletal Muscle Index Range by Age and Gender
RSMI values are not static. They change across your lifespan, and understanding where you sit relative to your age group gives important clinical context beyond the basic low/normal cutoff.
| Age Group | Men – Average RSMI | Women – Average RSMI |
|---|---|---|
| 18–39 | 9.5–10.5 kg/m² | 6.5–7.5 kg/m² |
| 40–59 | 8.5–9.5 kg/m² | 6.0–7.0 kg/m² |
| 60–69 | 7.5–8.5 kg/m² | 5.5–6.5 kg/m² |
| 70–79 | 7.0–8.0 kg/m² | 5.2–6.0 kg/m² |
| 80+ | 6.5–7.5 kg/m² | 4.8–5.5 kg/m² |
Note: These are approximate reference ranges based on population data. Individual variation exists.
For men, testosterone decline after age 40 gradually reduces the anabolic stimulus for muscle protein synthesis. For women, the menopause transition (typically ages 45–55) brings a sharper drop in estrogen that accelerates muscle loss during that window.
This is why RSMI screening is particularly valuable in:
- Adults over 50 as a baseline measurement
- Post-menopausal women where muscle decline accelerates
- Men over 60 experience an androgen decline, which is associated with inactivity-related loss
- Anyone recovering from a serious illness, where rapid muscle wasting can occur
What Is Skeletal Muscle Percentage?
Skeletal muscle percentage refers to the proportion of your total body weight made up by skeletal muscle. While RSMI uses absolute muscle mass relative to height, muscle percentage gives a different but complementary view.
General healthy ranges for skeletal muscle percentage:
| Gender | Healthy Range |
|---|---|
| Men | 38–54% of body weight |
| Women | 28–39% of body weight |
Skeletal muscle percentage and RSMI are related but not identical. You can have a normal muscle percentage but a low RSMI if your height is above average. This is why RSMI remains the preferred clinical metric — it accounts for body size in a way that simple percentage measures do not.
How to Measure Skeletal Muscle Mass for RSMI
Getting an accurate RSMI score depends entirely on the quality of your skeletal muscle mass measurement. There are four main methods used clinically, each with different levels of accuracy and accessibility.
1. DXA Scan (Gold Standard)
Dual-Energy X-ray Absorptiometry (DXA) is the most accurate method for measuring appendicular skeletal muscle mass. It uses two low-dose X-ray beams to distinguish between bone, fat, and lean tissue across your entire body.
- Accuracy: Highest available
- Cost: Moderate (typically $100–$250 per scan)
- Availability: Hospitals, radiology centers, and some sports medicine clinics
- Radiation: Very low — comparable to a short flight
DXA directly measures ASM in your arms and legs separately, giving the most reliable input for RSMI calculation. Baumgartner’s original research used DXA, which is why it remains the reference standard.
2. Bioelectrical Impedance Analysis (BIA)
BIA works by sending a small electrical current through your body. Muscle conducts electricity differently from fat, allowing the device to estimate body composition.
- Accuracy: Good — within 5–10% of DXA in healthy adults
- Cost: Low (home devices from $30; clinical devices $500+)
- Availability: Very high — many gyms, clinics, home scales
- Limitations: Hydration status significantly affects readings
BIA is the most practical option for routine monitoring. For the most accurate BIA reading, test in the morning after using the bathroom, without eating or exercising for at least 4 hours.
3. MRI and CT Scan
Both MRI and CT provide highly accurate body composition data and are considered research-grade tools. However, their high cost, radiation exposure (CT), and limited accessibility make them impractical for routine RSMI assessment.
4. Comparison Table
| Method | Cost | Accessibility | Best For |
|---|---|---|---|
| DXA | Moderate | Medium | Clinical diagnosis |
| BIA | Low | High | Routine monitoring |
| MRI | Very High | Low | Research |
| CT | High | Low | Research |
Is Muscle Density Genetic?
Yes, muscle density has a genetic component, but it is far from the whole story. Studies on twins suggest that genetics accounts for approximately 50–80% of the variation in muscle mass and strength between individuals.
However, the remaining 20–50% is shaped by lifestyle factors, most importantly, resistance training, protein intake, sleep quality, and hormonal health. Even people with a genetic predisposition to lower muscle mass can significantly improve their RSMI through consistent training and nutrition. Genetics sets your ceiling, but your habits determine how close you get to it.
RSMI and Sarcopenia – Understanding the Connection
Sarcopenia is the medical term for the progressive loss of skeletal muscle mass and strength that occurs with aging. It was formally recognized as a disease in 2016 when it received its own ICD-10 code (M62.84), though Cachexia (ICD-10 R64), a more severe form of muscle and weight loss, has long been coded in clinical practice.
RSMI is one of the primary tools used to diagnose sarcopenia. According to the European Working Group on Sarcopenia in Older People (EWGSOP2), low muscle quantity measured by RSMI, combined with low muscle strength (often assessed by grip strength) and low physical performance, confirms a sarcopenia diagnosis.
The RSMI-Sarcopenia Diagnostic Pathway
textStep 1: Screen → Low RSMI (below gender cutoff)
Step 2: Confirm → Low grip strength or low physical performance
Step 3: Assess Severity → Combination of all three markers
Sarcopenia is not just a problem of weakness. Low RSMI is independently associated with:
- Higher risk of falls and fractures
- Longer hospital stays after surgery
- Slower recovery from illness
- Higher all-cause mortality in adults over 65
- Increased insulin resistance and type 2 diabetes risk
Dynapenia vs Sarcopenia
Dynapenia refers specifically to age-related loss of muscle strength without necessarily having low muscle mass. A person can be dynapenic with a normal RSMI if their muscles have poor quality, less contractile tissue, and more fat infiltration within the muscle fibers.
RSMI measures muscle quantity, not muscle quality. This is why grip strength testing and gait speed assessment are important additions to RSMI in a full sarcopenia workup.
What Is Skeletal Muscle Disease?
Skeletal muscle diseases, also called myopathies, are conditions that impair the structure or function of skeletal muscle. Examples include:
- Muscular dystrophy is a genetic disorder causing progressive muscle degeneration
- Inflammatory myopathies include polymyositis and dermatomyositis
- Metabolic myopathies are enzyme deficiencies affecting muscle energy production
- Sarcopenia, age-related muscle loss (now classified as a disease)
- Cachexia, severe muscle wasting linked to cancer, heart failure, or chronic disease
RSMI helps screen for conditions involving significant muscle mass loss. However, a full clinical workup — including blood tests, electromyography, and sometimes a muscle biopsy- is needed for specific disease diagnosis.
What Is True About Skeletal Muscle?
Here are key facts that every person tracking their RSMI should understand:
- Skeletal muscle is the largest metabolic organ in the body by mass
- It accounts for approximately 40% of total body weight in healthy adults
- Skeletal muscle is responsible for over 80% of glucose uptake after a meal
- It plays a major role in thermoregulation, generating heat to maintain body temperature
- Skeletal muscle is voluntary; you consciously control its contractions
- It is the only muscle type that can be significantly increased through exercise
- Skeletal muscle produces myokines, hormones that communicate with the brain, liver, and immune system, promoting overall health
RSMI vs Other Body Composition Measures
Before/After Example – Why RSMI Reveals What BMI Misses
Patient Profile: 68-year-old woman, 165 cm, 72 kg
| Measure | Value | Interpretation |
|---|---|---|
| BMI | 26.4 kg/m² | Normal weight |
| Body Fat % | 42% | High |
| Skeletal Muscle Mass | 17.2 kg | — |
| RSMI | 6.33 kg/m² | Below normal |
BMI says this woman is at a healthy weight. RSMI reveals she has sarcopenic obesity — critically low muscle mass combined with high body fat. Without RSMI assessment, this condition would be completely invisible using standard screening tools.
Full Comparison Table
| Measure | What It Measures | Detects Low Muscle? | Detects High Fat? | Clinical Value for Aging |
|---|---|---|---|---|
| BMI | Weight/height ratio | No | Partially | Low |
| Body Fat % | Fat as % of body weight | No | Yes | Moderate |
| Lean Body Mass (LBM) | All non-fat mass | Partially | No | Moderate |
| RSMI | Skeletal muscle/height² | Yes | No | High |
| RSMI + Body Fat % | Combined assessment | Yes | Yes | Highest |
What Is the Difference Between Relative and Absolute Muscle Measurement?
- Absolute muscle mass is the raw number — for example, 22 kg of skeletal muscle. This tells you the total amount of muscle but does not account for body size.
- Relative muscle mass (what RSMI measures) divides that number by height squared. This normalizes the value so that a 5’4″ person and a 6’2″ person can be fairly compared.
Relative measures are more useful in clinical practice because they account for individual body size differences — the same reason blood pressure is more informative than simply knowing your heart rate.
Relative Strength vs Absolute Strength
Similarly, relative strength measures how strong you are relative to your body weight. Absolute strength is simply how much weight you can lift, regardless of body size.
For health assessments, relative measures win because they reflect how your physiology performs in proportion to your size, which is exactly what RSMI does for skeletal muscle.
RSMI vs Lean Body Mass (LBM)
Lean Body Mass includes everything that is not fat — bones, organs, water, and muscle. RSMI focuses only on skeletal muscle in the limbs, making it a much more specific marker for muscle health and functional capacity. For more details on lean body mass measurement, see our Lean Body Mass Calculator.
Improving Your RSMI Score
The encouraging reality is that low RSMI is not a life sentence. At virtually any age, the right combination of exercise and nutrition can meaningfully improve your skeletal muscle mass and push your RSMI score into a healthier range.
1. Resistance Training – The Most Powerful Tool
Resistance training — also called strength training or weight training — is the single most effective intervention for increasing skeletal muscle mass and improving RSMI.
Evidence-based recommendations:
- Train 2–4 days per week with at least 48 hours rest between sessions, targeting the same muscle groups
- Focus on compound movements, squats, deadlifts, rows, presses, that recruit large amounts of muscle
- Use progressive overload, gradually increase weight or resistance over time
- Even bodyweight exercises (push-ups, lunges, chair stands) produce meaningful results in older or deconditioned adults
A 2017 meta-analysis published in the British Journal of Sports Medicine confirmed that progressive resistance training significantly increased muscle mass in older adults across all fitness levels.
2. Protein Intake – Feed Your Muscles
Skeletal muscle is built from protein. Without adequate dietary protein, your body cannot repair and grow muscle tissue — regardless of how hard you train.
Recommendations for muscle mass maintenance and growth:
| Population | Daily Protein Target |
|---|---|
| General healthy adults | 0.8–1.0 g per kg body weight |
| Active adults | 1.2–1.6 g per kg body weight |
| Older adults (65+) | 1.2–2.0 g per kg body weight |
| Sarcopenia risk or recovery | 1.6–2.4 g per kg body weight |
Protein timing matters too. Distributing protein evenly across 3–4 meals — rather than eating most of it in one sitting — maximizes muscle protein synthesis throughout the day. A 20–40g protein serving within 2 hours after resistance training is particularly effective.
3. Nutritional Cofactors
Beyond protein, several nutrients directly support skeletal muscle health:
- Vitamin D: Deficiency is associated with lower muscle mass and higher sarcopenia risk. Target serum levels of 40–60 ng/mL.
- Creatine: Well-supported evidence shows creatine supplementation (3–5g/day) enhances strength training adaptations, particularly in older adults.
- Omega-3 Fatty Acids: Anti-inflammatory effects that reduce muscle protein breakdown, particularly in aging and illness.
- Leucine: A branched-chain amino acid that directly triggers muscle protein synthesis. Found in whey protein, meat, fish, and eggs.
4. Lifestyle Factors
- Sleep: Muscle repair happens during sleep. Aim for 7–9 hours per night. Growth hormone — critical for muscle maintenance — is released primarily during deep sleep.
- Reduce sedentary time: Even breaking up long sitting periods with short walks helps preserve muscle mass.
- Manage chronic conditions: Conditions like type 2 diabetes, COPD, and heart failure accelerate muscle loss. Good disease management protects RSMI.
- Avoid smoking and excess alcohol: Both independently accelerate muscle catabolism.
Clinical Applications of RSMI
RSMI is not just a fitness metric. It has meaningful clinical applications across multiple medical specialties.
Geriatric Medicine
RSMI is a core component of comprehensive geriatric assessment. Low RSMI in older adults predicts fall risk, hospitalization risk, and functional decline — helping clinicians target interventions before disability occurs.
Oncology
Cancer-related cachexia — severe muscle wasting — is a leading cause of cancer mortality. Monitoring RSMI in cancer patients helps track muscle loss during treatment and guides nutritional and physical rehabilitation interventions.
Pre-Surgical Screening
Low preoperative RSMI is associated with longer hospital stays, higher complication rates, and slower recovery after major surgery. Some surgical centers now use RSMI as part of routine pre-operative risk stratification.
Sports Medicine and Athletics
In athletic populations, RSMI helps track lean mass changes during training cycles, identify over-training effects, and monitor recovery from injury. Athletes aiming to improve power-to-weight ratios can use RSMI to ensure they are gaining muscle rather than fat.
Rehabilitation Medicine
Patients recovering from prolonged bed rest, stroke, or serious illness lose muscle mass rapidly. RSMI provides an objective baseline and progress marker during rehabilitation, helping teams adjust protein and exercise prescriptions accordingly.
Warning Signs of Low RSMI
Low skeletal muscle mass often develops silently over the years. By the time someone notices an obvious weakness, significant RSMI decline may have already occurred. Watch for these early warning signs:
Physical Warning Signs:
- Difficulty rising from a chair without using your arms
- Slower walking pace than age peers
- Feeling unusually fatigued after light physical activity
- Frequent falls or near-falls
- Weak grip — struggling with jar lids or carrying shopping bags
- Noticeable reduction in muscle definition despite stable body weight
Metabolic Warning Signs:
- Rising fasting blood glucose or diagnosed insulin resistance
- Unexplained weight loss (which may reflect muscle loss, not fat loss)
- Low albumin or pre-albumin on blood tests (markers of protein status)
Lifestyle Risk Factors That Accelerate RSMI Decline:
- Eating less than 1.0g of protein per kg body weight daily
- Exercising fewer than 2 days per week
- Recovering from a recent illness, surgery, or hospitalization
- Diagnosed with cancer, COPD, heart failure, or chronic kidney disease
- Over age 60 with no structured resistance training history
If you recognize several of these warning signs, calculating your RSMI and discussing results with your doctor is an important next step.
Common Mistakes When Using RSMI
Mistake 1: Using BIA Right After Exercise or Eating
BIA readings are heavily affected by hydration and fluid distribution. Exercising or eating before testing artificially lowers your muscle mass reading and inflates body fat estimates. Always test fasted, after using the bathroom, and before exercise.
Mistake 2: Ignoring Body Fat Percentage
RSMI alone does not give the full picture. A normal RSMI with very high body fat still places you in the Obese category with elevated metabolic risk. Always interpret RSMI alongside body fat percentage for meaningful clinical insight.
Mistake 3: Using Height in Centimeters Instead of Meters
This is the most common calculation error. If you use centimeters in the formula instead of meters, your height² will be thousands of times larger, producing an impossibly tiny RSMI score. Always convert to meters first.
Mistake 4: Assuming BMI Reflects Muscle Health
BMI tells you nothing about your body composition. A healthy BMI does not rule out low RSMI or sarcopenic obesity. If you are relying only on BMI to assess your health, you are missing critical information.
Mistake 5: One-Time Testing Without Follow-Up
RSMI is most valuable as a longitudinal tracking tool. A single measurement gives you a snapshot. Testing every 6–12 months shows whether your muscle mass is being maintained, declining, or improving — and lets you adjust your nutrition and exercise strategy accordingly.
Mistake 6: Applying Adult Cutoffs to Adolescents
The Baumgartner cutoffs (7.26 for men, 5.45 for women) were established using adult and older adult populations. Applying these numbers to teenagers or young adults is not clinically valid. RSMI is best used in adults aged 18 and older.
Related Calculators
- Lean Body Mass (LBM) Calculator
- Grip Strength Calculator
- Sarcopenia Risk Calculator
- Muscle Mass Calculator
- Body Fat Percentage Calculator
Frequently Asked Questions
RSMI is a body composition metric that measures appendicular skeletal muscle mass relative to height squared. Developed by Baumgartner in 1998, it is calculated as: ASM (kg) ÷ Height² (m²). It is the primary tool used to screen for low skeletal muscle mass and sarcopenia risk in adults.
BMI measures your total body weight relative to height. It cannot distinguish muscle from fat. RSMI specifically measures skeletal muscle mass relative to height, making it far more accurate for detecting muscle loss, especially in older adults who may have a normal BMI but critically low muscle mass.
The established cutoff values from Baumgartner’s research are < 7.26 kg/m² for men and < 5.45 kg/m² for women. Scoring below these thresholds indicates low skeletal muscle mass and elevated sarcopenia risk.
Yes. Progressive resistance training combined with adequate protein intake (1.2–2.0g per kg body weight for older adults) can meaningfully increase skeletal muscle mass and improve RSMI at any age, including well into your 70s and 80s.
RSMI calculated using BIA-measured muscle mass is a reasonable approximation but slightly less accurate than DXA. For clinical diagnosis, DXA is preferred. For personal tracking and routine monitoring, BIA is a practical and acceptable alternative.
Low RSMI means you have less skeletal muscle than is considered healthy for your height and gender. It is associated with higher risks of falls, fractures, disability, metabolic conditions like insulin resistance, and increased mortality — particularly in adults over 60.
Skeletal muscle is not a structural material like bone. It is soft contractile tissue attached to the skeleton via tendons. Bone provides the rigid framework; skeletal muscle generates the forces that move that framework. They work together but are biologically distinct tissues.
Bones serve as attachment points and levers for skeletal muscle. When a muscle contracts, it pulls on the bone it is attached to via tendons, creating movement. Bones also protect muscles and allow muscles to generate force efficiently. This relationship is called the musculoskeletal system.
Skeletal muscle percentage is your skeletal muscle mass expressed as a proportion of your total body weight. Healthy ranges are approximately 38–54% for men and 28–39% for women. It complements RSMI but does not replace it, as RSMI adjusts for height differences between individuals.
Genetics accounts for an estimated 50–80% of variation in baseline muscle mass and density. However, lifestyle factors — especially resistance training and protein intake — significantly shape how much of your genetic potential you realize and how well you maintain muscle mass over time.
References
- Baumgartner RN, Koehler KM, Gallagher D, et al. Epidemiology of Sarcopenia among the Elderly in New Mexico. American Journal of Epidemiology. 1998;147(8):755–763.
- Cruz-Jentoft AJ, Bahat G, Bauer J, et al. Sarcopenia: Revised European Consensus on Definition and Diagnosis (EWGSOP2). Age and Ageing. 2019;48(1):16–31.
- Janssen I, Heymsfield SB, Ross R. Low Relative Skeletal Muscle Mass (Sarcopenia) in Older Persons Is Associated with Functional Impairment and Physical Disability. Journal of the American Geriatrics Society. 2002;50(5):889–896.
- Janssen I, Shepard DS, Katzmarzyk PT, Roubenoff R. The Healthcare Costs of Sarcopenia in the United States. Journal of the American Geriatrics Society. 2004;52(1):80–85.
- Peterson MD, Sen A, Gordon PM. Influence of Resistance Exercise on Lean Body Mass in Aging Adults. Medicine & Science in Sports & Exercise. 2011;43(2):249–258.
- Landi F, Cruz-Jentoft AJ, Liperoti R, et al. Sarcopenia and Mortality Risk in Frail Older Persons Aged 80 Years and Older. Age and Ageing. 2013;42(2):203–209.
- Morley JE, Abbatecola AM, Argiles JM, et al. Sarcopenia with Limited Mobility: An International Consensus. Journal of the American Medical Directors Association. 2011;12(6):403–409.
- National Institutes of Health (NIH). Body Composition Research. National Institute on Aging. https://www.nia.nih.gov