Grip Strength Calculator
Compare your hand strength against clinical peer group data (SOEP study) based on age, height, and gender.
Enter your measurements to see your percentile ranking and peer comparison.
Key Takeaways
- The Grip Strength Calculator gives you a percentile ranking based on real population data from 11,790 people
- You need both left and right-hand scores for a complete picture of your hand strength
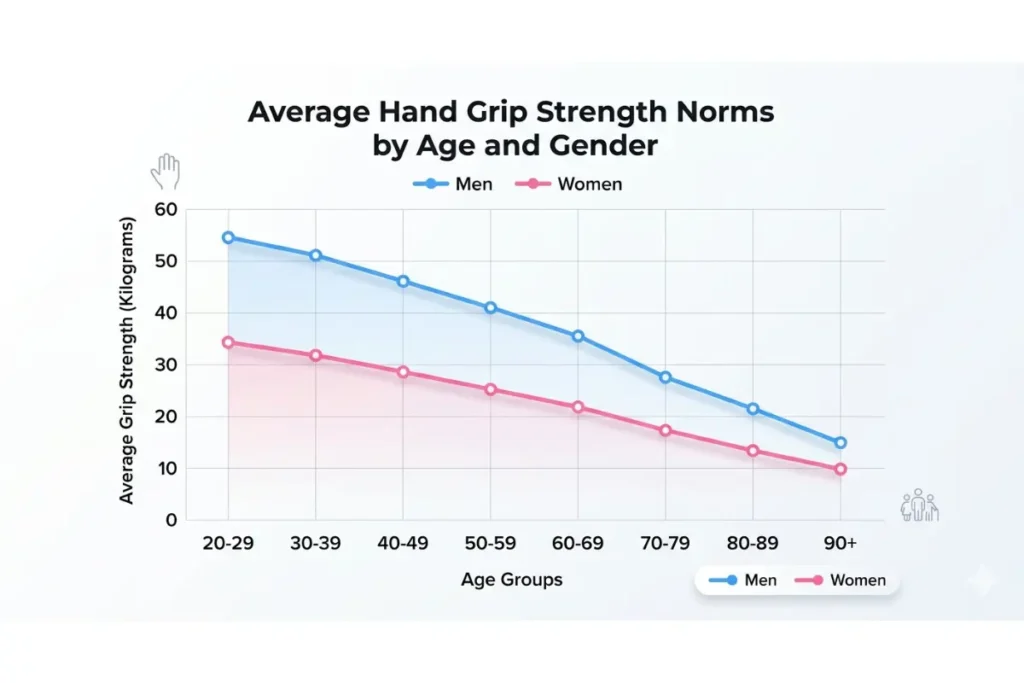
- Average grip strength for men is around 35–45 kg, for women it is around 20–30 kg
- Grip strength declines naturally with age, but the rate depends heavily on activity level
- Low grip strength links directly to higher health risks, including heart disease, sarcopenia, and frailty
- You can meaningfully improve grip strength at any age with the right training approach
What Is the Grip Strength Calculator?
The Grip Strength Calculator is a free online tool. It takes your hand grip measurements and tells you exactly where you stand compared to other people your age, gender, and height.
Most people have no idea whether their grip strength is strong, average, or weak. This tool answers that question with real data — not guesswork.
What This Tool Measures
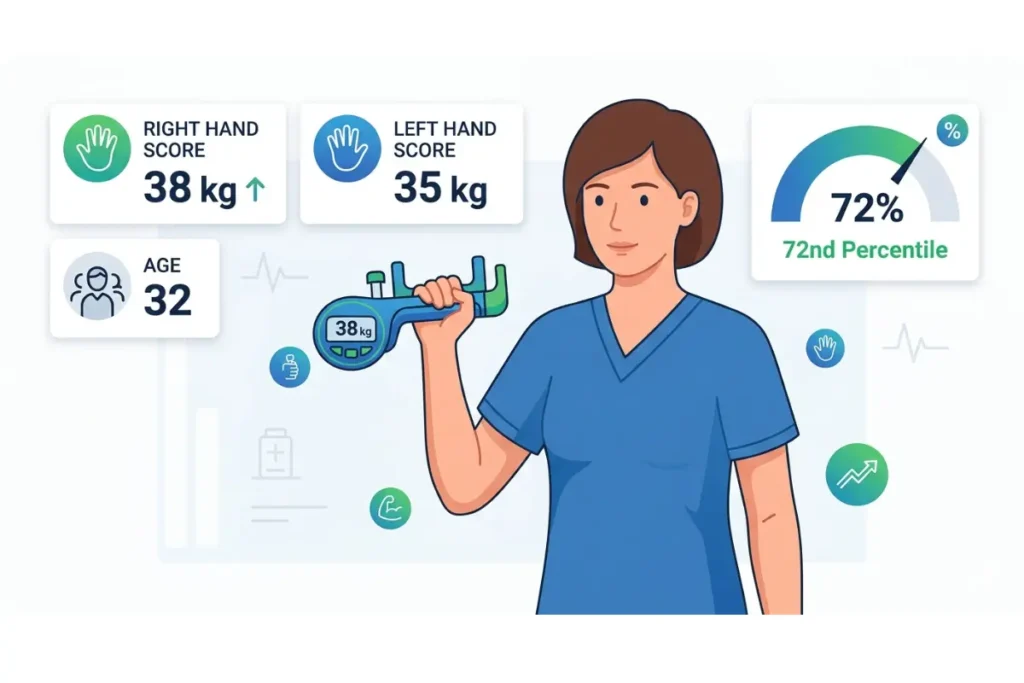
The calculator measures hand grip strength in kilograms or pounds. You enter your left-hand score, your right-hand score, your age, your height, and your gender. The tool then calculates three things:
- Your percentile ranking within your peer group
- How your score compares to the average grip strength for people like you
- The strength difference between your left and right hands
It does not just give you a number. It gives that number context, which is what makes it genuinely useful.
How It Compares Your Score to Real Population Data
This calculator uses data from the German Socio-Economic Panel (SOEP), a large-scale, long-running survey covering thousands of real people. The specific study behind this tool involved 11,790 individuals across five data waves from 2006 to 2014.
That means your score is not compared to an estimated average. It is compared to 25,285 actual grip strength observations from men and women aged 17 to 90. That is a meaningful, scientifically grounded comparison.
Why Both Hands Are Measured Separately
Most people assume their dominant hand is always stronger. However, that is not always true. Measuring both hands separately reveals something important — your left-right strength imbalance.
A small difference between hands is completely normal. However, a gap larger than 10–15% between your stronger hand and weaker hand may signal a muscular imbalance worth addressing. This calculator shows you that percentage directly, so you can act on it.
How to Use the Grip Strength Calculator (Step-by-Step)
Using this tool is straightforward. However, accurate results depend on entering correct measurements. Here is exactly what to do.
Step 1: Choose Your Units
First, select whether you want to work in metric (kg and cm) or imperial (lbs, feet, and inches). Both options give identical results — just in different units. Most clinical grip strength standards use kilograms, so metric is recommended if you want to compare against published grip strength norms.
Step 2: Select Your Gender
Select male, female, or the average of both genders. Gender matters here because grip strength norms differ significantly between men and women. Men typically produce higher absolute force. However, when adjusted for body size and age, the patterns are surprisingly similar.
Step 3: Measure and Enter Left Hand Grip Strength
Measure your left hand using a handgrip dynamometer. Record the maximum value from your best attempt. Enter that number into the left-hand grip field. Most adults fall between 20 and 80 kg — so if your number falls outside that range, recheck your measurement technique.
Step 4: Measure and Enter Right Hand Grip Strength
Repeat the same process for your right hand. Take your best score from multiple attempts. Enter it into the right-hand grip field. The calculator uses both scores to assess your muscular strength, symmetry, and overall hand strength.
Step 5: Enter Your Age and Height
Enter your age in years. This calculator accepts ages from 17 to 90. Then enter your height. The tool accepts 150 cm and above for women and 160 cm and above for men. Height matters because taller people generally have longer forearms and larger hands, which affects grip strength norms.
Step 6: Read Your Results and Percentile
After entering all five inputs, the calculator shows your results instantly. You will see:
- Your grip strength percentile ranking
- Your score compared to the peer group average
- How many standard deviations above or below the average are you
- Your left-right strength imbalance as a percentage
How to Measure Grip Strength Correctly
Your results are only as good as your measurements. Poor technique produces inaccurate scores. Here is the correct method used in clinical and research settings.
Equipment You Need: Handgrip Dynamometer
You need a handgrip dynamometer to measure grip strength accurately. This is a small handheld device that reads the force of your squeeze in kilograms or pounds.
Two widely used and well-researched models are:
- Jamar Dynamometer — the most referenced device in clinical research
- TKK 5101 Dynamometer — validated in multiple peer-reviewed studies
Both devices produce reliable and comparable measurements when used correctly. Many gyms, physiotherapy clinics, and hospitals have these devices available.
Standard Grip Strength Test Procedure
Follow this exact sequence for accurate results:
- Stand upright — do not sit or lean
- Keep your upper arm close to your torso
- Bend your elbow at a right angle — 90 degrees
- Hold the dynamometer in one hand with a neutral wrist position
- Squeeze as hard as possible for 3 to 5 seconds
- Record the maximum reading displayed
- Rest for 60 seconds between attempts
- Take 3 attempts per hand and use the best score
This is the standardized protocol used in the SOEP study that powers this calculator.
Elbow Position and Why It Matters
Elbow position has a direct effect on grip strength output. Research by Kolimechkov and colleagues (2020) confirmed that elbow position significantly affects handgrip strength test results, both in terms of validity and reliability.
The 90-degree elbow position produces the most consistent and comparable results. Other angles can inflate or deflate your reading by several kilograms. Always use the 90-degree position for accurate data.
How Many Attempts Should You Take?
Always take three attempts per hand. Use the best score — not the average. Grip strength is a maximum effort test. Your best attempt reflects your true capacity. Averaging scores underestimates your actual strength because fatigue in earlier attempts pulls the numbers down.
Dominant Hand vs Non-Dominant Hand
Your dominant hand is usually — but not always — stronger. Research shows the dominant hand typically exceeds the non-dominant hand by around 10%. However, this varies significantly based on your daily activities, sports participation, and injury history.
Always measure both hands. Never assume one hand’s result applies to the other.
Understanding Your Grip Strength Results
Your calculator results give you four pieces of information. Here is what each one means.
What Is a Grip Strength Percentile?
Your grip strength percentile tells you what percentage of your peer group you are stronger than. For example:
- 50th percentile = you are stronger than 50% of people your age, gender, and height
- 75th percentile = you are stronger than 75% of your peer group
- 25th percentile = 75% of your peer group is stronger than you
A higher percentile is better. However, the 50th percentile is not a bad result — it means you are exactly at the population average for people like you.
What Is the Average Grip Strength?
The average grip strength varies by age, gender, and height. As a general reference:
| Group | Average Single Hand Grip |
|---|---|
| Men aged 20–29 | 46–48 kg |
| Men aged 40–49 | 44–46 kg |
| Men aged 60–69 | 38–40 kg |
| Women aged 20–29 | 28–30 kg |
| Women aged 40–49 | 27–29 kg |
| Women aged 60–69 | 22–25 kg |
These figures are approximate population averages. Your calculator result uses the precise SOEP data matched to your specific age, gender, and height.
What Does Standard Deviation Mean in Your Score?
Standard deviation (σ) shows how spread out grip strength scores are within your peer group. Your result shows how many standard deviations above or below average you sit.
- Within 1 standard deviation = normal range
- 1–2 standard deviations above = notably strong
- 1–2 standard deviations below = notably weak — worth investigating
- Beyond 2 standard deviations = clinically significant — see a professional
Left-Right Strength Imbalance: What Is Healthy?
A 0–10% difference between your stronger and weaker hand is completely normal. Most people show some asymmetry. However, a gap above 15% is worth paying attention to.
Large imbalances can result from:
- Previous hand or wrist injuries
- Repetitive one-sided activities
- Neurological conditions affecting one side
- Significant differences in daily hand use
The calculator displays your imbalance as a percentage. It also tells you which hand is stronger and by how many kilograms.
Grip Strength Chart by Age and Gender
Understanding grip strength norms helps you put your score in context. Here are the reference ranges used in clinical and research settings.
Grip Strength Norms for Men by Age (kg)
| Age Group | Weak | Below Average | Average | Above Average | Strong |
|---|---|---|---|---|---|
| 17–19 | Below 34 | 34–40 | 41–47 | 48–54 | Above 54 |
| 20–29 | Below 36 | 36–43 | 44–50 | 51–57 | Above 57 |
| 30–39 | Below 35 | 35–42 | 43–49 | 50–56 | Above 56 |
| 40–49 | Below 33 | 33–40 | 41–47 | 48–54 | Above 54 |
| 50–59 | Below 30 | 30–37 | 38–44 | 45–51 | Above 51 |
| 60–69 | Below 26 | 26–33 | 34–40 | 41–47 | Above 47 |
| 70+ | Below 22 | 22–29 | 30–36 | 37–43 | Above 43 |
Grip Strength Norms for Women by Age (kg)
| Age Group | Weak | Below Average | Average | Above Average | Strong |
|---|---|---|---|---|---|
| 17–19 | Below 18 | 18–22 | 23–27 | 28–32 | Above 32 |
| 20–29 | Below 19 | 19–23 | 24–28 | 29–33 | Above 33 |
| 30–39 | Below 18 | 18–22 | 23–27 | 28–32 | Above 32 |
| 40–49 | Below 17 | 17–21 | 22–26 | 27–31 | Above 31 |
| 50–59 | Below 15 | 15–19 | 20–24 | 25–29 | Above 29 |
| 60–69 | Below 13 | 13–17 | 18–22 | 23–27 | Above 27 |
| 70+ | Below 11 | 11–15 | 16–20 | 21–25 | Above 25 |
Values are approximate single-hand averages. Use the calculator for your precise peer-group comparison.
Is 40 kg Grip Strength Good?
Yes — for most adults, 40 kg is a good grip strength score. For men under 50, it sits around the average to above-average range. For men over 60, it is above average. For women of any age, 40 kg is an impressive result — well above average across all age groups. However, context matters. Use the calculator to compare 40 kg against your specific age, gender, and height peer group.
Is 250 lb Grip Strength Good?
250 lbs equals approximately 113 kg — that is an exceptional grip strength score. This level is rare even among competitive strength athletes. For context, world-class powerlifters and strongman competitors typically measure in the 130–160 kg range. A 250 lb grip strength would place most adults in the 99th percentile regardless of age or gender.
What Is a Good Grip Strength by Age?
A good grip strength sits at or above the 50th percentile for your age, gender, and height group. In practical terms:
- Men aged 30–50: 40–50 kg per hand is a solid target
- Men aged 60+: 35–42 kg per hand indicates good strength
- Women aged 30–50: 25–32 kg per hand is a strong result
- Women aged 60+: 20–26 kg per hand is above average
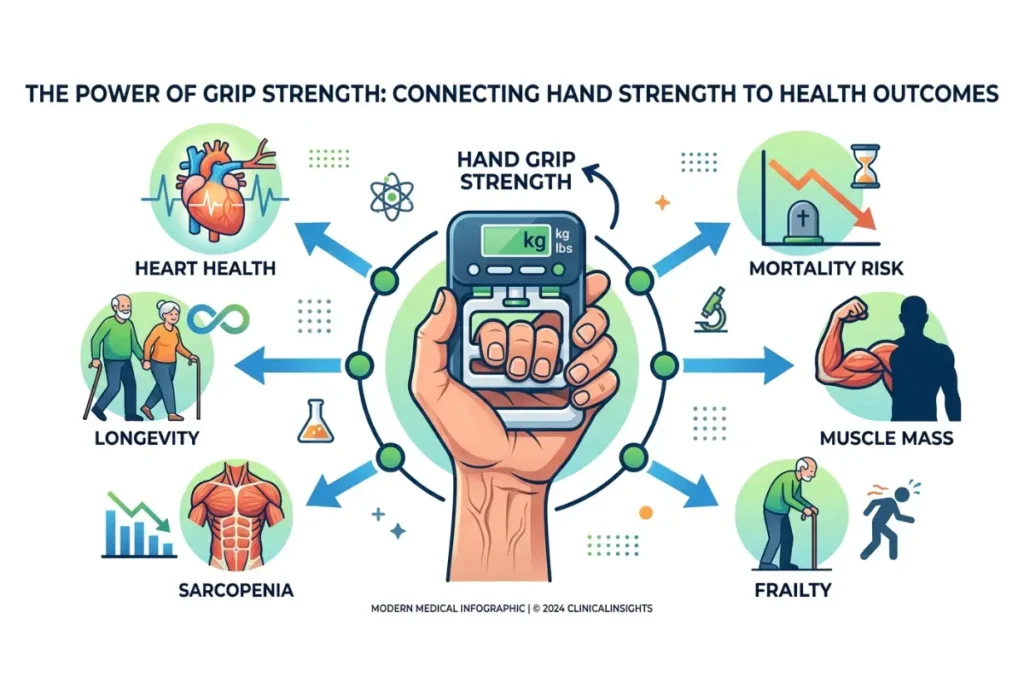
What Does Your Grip Strength Score Mean for Your Health?
Grip strength is not just a fitness metric. It is one of the most researched predictors of overall health in adults. Here is what the science consistently shows.
Grip Strength and Mortality Risk
Multiple large-scale studies have found a direct link between grip strength and survival. A landmark study published in The Lancet (2015), the Prospective Urban Rural Epidemiology (PURE) study, tracked 139,691 adults across 17 countries. It found that every 5 kg decrease in grip strength was associated with a 16% higher risk of death from any cause.
That is a striking finding. It means your grip strength score is not just about your hands — it reflects the condition of your entire musculoskeletal system.
Grip Strength and Cardiovascular Health
The same PURE study found that low grip strength predicted cardiovascular disease more strongly than blood pressure in some populations. Furthermore, a weaker grip was associated with higher rates of heart attack and stroke.
This does not mean grip strength causes heart disease. However, it does mean that low grip strength is a reliable early warning signal that something in your body’s physical reserve system needs attention.
Grip Strength and Longevity
Research consistently shows that people with stronger grip strength live longer, on average. This connection holds even after adjusting for age, body mass index, physical activity level, and chronic disease. In short, grip strength works as a proxy for overall biological resilience — how well your body handles physical stress over time.
Grip Strength and Sarcopenia
Sarcopenia — the age-related loss of muscle mass and strength — is first detected in many people through a grip strength test. The EWGSOP2 guidelines from the European Working Group on Sarcopenia in Older People place low grip strength as the primary diagnostic indicator for probable sarcopenia.
If your grip strength falls below clinical cutoffs — 27 kg for men and 16 kg for women — it triggers further investigation into muscle mass and physical function. Early detection matters because sarcopenia responds well to resistance training and protein optimization when caught early. You can use our Sarcopenia Risk Calculator to assess your full muscle loss risk profile.
Grip Strength and Frailty in Older Adults
Frailty is a clinical syndrome where the body loses its ability to recover from physical stress. Low grip strength is one of the five Fried frailty criteria — the gold standard framework for identifying frailty in older adults.
For older adults specifically, low grip strength is a powerful predictor of:
- Higher falls risk
- Longer hospital stays after surgery
- Slower recovery from illness
- Reduced functional independence
This is why grip strength testing is now a standard part of geriatric assessment in hospitals and clinical settings worldwide.
Grip Strength and Muscle Mass
Grip strength and overall muscle mass are strongly correlated. However, they are not the same thing. You can have relatively high muscle mass with poor grip strength — and vice versa. Together, they tell a more complete story.
People with both high muscle mass and strong grip strength consistently show the best health outcomes. People with low scores on both measures face the highest risk of functional decline in older adults, physical disability, and poor quality of life.
Weak Grip Strength: Causes and Warning Signs
Low grip strength has several possible causes. Some are temporary and easily fixed. Others signal something more serious.
Common causes of weak grip strength:
| Cause | Type | Action |
|---|---|---|
| Physical inactivity | Lifestyle | Start grip training |
| Age-related muscle loss | Biological | Resistance training + protein |
| Osteoarthritis of the hand | Medical | See a doctor |
| Carpal tunnel syndrome | Medical | See a doctor |
| Rheumatoid arthritis | Medical | See a rheumatologist |
| Peripheral neuropathy | Neurological | Medical evaluation |
| Vitamin D deficiency | Nutritional | Blood test + supplementation |
| Diabetes-related nerve damage | Medical | Diabetes management |
| Stroke or neurological event | Neurological | Urgent medical review |
| Obesity | Metabolic | Weight management program |
Warning signs that low grip strength needs medical attention:
- Sudden unexplained drop in grip strength
- Grip weakness affecting only one hand significantly
- Grip weakness accompanied by numbness or tingling
- Weakness progressing over weeks or months
- Grip weakness in someone under 40 with no obvious cause
Grip Strength by Sport and Activity Level
Grip strength requirements vary enormously between sports. Here is how different activities compare.
Grip Strength for Athletes
Athletes generally score significantly above population averages. However, the degree varies by sport. Sports that demand constant hand force — like rock climbing, gymnastics, and wrestling — produce the highest grip strength scores. Team sport athletes typically score above average but below specialist grip athletes.
Grip Strength for Powerlifting and Strength Sports
Powerlifters and strongman competitors often develop grip strength as a byproduct of heavy training. Deadlifts, rows, and farmer carries all build forearm strength. However, grip is often a limiting factor in heavy lifts, which is why many competitive lifters train grip specifically.
Typical grip strength in strength athletes:
| Level | Average Grip (Men) | Average Grip (Women) |
|---|---|---|
| Recreational | 45–55 kg | 28–35 kg |
| Competitive amateur | 55–70 kg | 35–45 kg |
| Elite/professional | 70–90 kg | 45–60 kg |
Grip Strength for Rock Climbing
Rock climbing produces some of the highest grip strength scores outside of specialist grip competitions. Elite climbers regularly measure 70–90 kg per hand. Furthermore, climbers develop exceptional pinch strength and finger flexor strength, which standard dynamometer tests do not fully capture.
If you are a climber, your dynamometer score will likely underestimate your full hand strength capacity.
Grip Strength for Bodybuilding
Bodybuilders often have above-average grip strength simply because of high muscle mass. However, many bodybuilders use lifting straps during training, which reduces the grip training stimulus. As a result, some bodybuilders have less grip strength relative to their overall muscle mass than you might expect.
Grip Strength for General Fitness
For general fitness goals, targeting the 60th to 75th percentile for your age and gender is a solid aim. This level of grip strength supports healthy daily function, reduces injury risk, and correlates with good overall physical health. You do not need to compete with strength athletes to get meaningful health benefits from improving your grip.
How to Improve Your Grip Strength
The good news is that grip strength responds quickly to targeted training. Most people see measurable improvements within 4 to 8 weeks of consistent effort.
Best Grip Strength Exercises
These exercises directly build hand and forearm strength:
| Exercise | Equipment | Primary Benefit |
|---|---|---|
| Dead hangs | Pull-up bar | Overall grip endurance |
| Farmer carries | Dumbbells or kettlebells | Crushing grip + forearm mass |
| Plate pinches | Weight plates | Pinch strength |
| Towel pull-ups | Towel over bar | Grip-specific pull strength |
| Wrist curls | Barbell or dumbbells | Forearm flexor strength |
| Reverse wrist curls | Barbell or dumbbells | Forearm extensor balance |
| Hand gripper squeezes | Grip trainer | Direct crushing strength |
| Rice bucket training | Bucket of rice | Full hand and finger strength |
Grip Strength Training for Beginners
If you are new to grip training, start simple. Begin with dead hangs from a pull-up bar. Hold for as long as you can. Rest. Repeat three times. Do this three days per week.
Additionally, add farmer carries to your routine. Pick up two heavy dumbbells and walk with them for 30 to 40 metres. This builds grip strength faster than almost any other single exercise.
After four weeks, add a hand gripper to your daily routine. Start with a resistance level you can close 10 to 15 times per set.
Grip Strength Training for Advanced Athletes
Advanced trainees benefit from more specific approaches:
- Thick bar training: Wrapping a towel around a barbell dramatically increases grip demand
- Axle bar deadlifts: A thicker bar forces the hand to work harder
- One-arm hangs: Significantly harder than two-arm hangs
- Timed holds at heavy weight: Loading the grip near its maximum for 5 to 10 second holds
- Wrist roller: Builds forearm endurance alongside strength
How Long Does It Take to Improve Grip Strength?
| Timeframe | Expected Improvement | Notes |
|---|---|---|
| 2–4 weeks | 5–10% increase | Neural adaptation — technique improves |
| 4–8 weeks | 10–20% increase | Muscle and tendon adaptation begins |
| 3–6 months | 20–40% increase | Consistent training with progressive load |
| 6–12 months | 30–60% increase | With dedicated grip-specific programming |
These are realistic estimates for consistent trainees. Results vary based on starting level, training frequency, and overall programme quality.
Tools That Help: Grippers, Bars, and Resistance Equipment
- Adjustable hand grippers (like Captains of Crush): allow progressive resistance increases
- Fat Gripz: attachments that make any barbell or dumbbell thicker
- Grip rings: soft silicone rings for low-intensity daily practice
- Pinch blocks: weighted blocks for developing pinch strength specifically
- Pull-up bars: essential for dead hangs and towel work
Grip Strength in Clinical and Rehabilitation Settings
Beyond fitness, grip strength plays an important role in healthcare. Clinicians use it regularly as a diagnostic and monitoring tool.
Grip Strength Test in Geriatric Assessment
Grip strength is now a standard measurement in comprehensive geriatric assessment. Hospitals and care facilities use it to:
- Screen for sarcopenia and frailty on admission
- Predict surgical risk and recovery time
- Monitor functional decline over time
- Identify patients who need early physiotherapy
The Jamar Dynamometer is the most commonly used device in clinical settings. Results are compared against validated normative reference values for the patient’s age and gender.
Grip Strength and Sarcopenia Screening
Both the EWGSOP2 (European) and AWGS 2019 (Asian) guidelines use grip strength as the first-line screening measurement for sarcopenia. A result below the cutoff triggers further assessment — including muscle mass measurement via dual-energy X-ray absorptiometry (DXA) or bioelectrical impedance analysis (BIA).
Clinical cutoffs for sarcopenia screening:
| Gender | Low Grip Strength Cutoff |
|---|---|
| Men | Below 27 kg (EWGSOP2) / Below 28 kg (AWGS 2019) |
| Women | Below 16 kg (EWGSOP2) / Below 18 kg (AWGS 2019) |
Grip Strength in Pre-Operative Assessment
Pre-operative grip strength predicts surgical outcomes in older adults. Patients with low grip strength before major surgery have:
- Longer intensive care unit stays
- Higher rates of post-operative complications
- Slower return to independent function
- Higher 30-day readmission rates
As a result, many surgical teams now include grip strength in their pre-operative assessment protocols for elderly patients.
Grip Strength in Rehabilitation Programs
Physiotherapists use grip strength measurement to:
- Establish a baseline at the start of rehabilitation
- Track progress week by week
- Identify when a patient is ready to return to work or sport
- Guide exercise prescription intensity
Serial grip strength testing, measuring at regular intervals, gives objective evidence of improvement. This removes guesswork from the rehabilitation process.
Grip Strength and Osteoarthritis
Osteoarthritis of the hand is one of the most common causes of reduced grip strength in adults over 50. It affects the small joints of the fingers and thumb, directly reducing the force production capacity of the hand.
However, targeted hand exercises can meaningfully improve grip strength even in people with osteoarthritis. Furthermore, a stronger grip in osteoarthritis patients correlates with less pain and better daily function. This makes grip training a valuable part of osteoarthritis management — not just a fitness goal.
The Science Behind This Calculator
Understanding where this calculator’s data comes from helps you trust your results.
Data Source: SOEP Survey and 2016 Study
This calculator is based on the German Socio-Economic Panel (SOEP) — one of the longest-running household surveys in the world. The grip strength data comes specifically from a 2016 study by Nora Steiber, published in PLOS ONE.
The study title is: “Strong or Weak Handgrip? Normative Reference Values for the German Population across the Life Course Stratified by Sex, Age, and Body Height.”
It provides grip strength norms stratified by:
- Sex (male and female)
- Age (17 to 90 years)
- Body height (150 cm to 190+ cm)
This level of stratification makes the comparison more meaningful than tools that only use age and gender.
Sample Size and Population Coverage
The dataset included:
- 11,790 individuals living in Germany
- 25,285 total observations across five data waves (2006–2014)
- Ages ranging from 17 to 90 years
- Heights from 150 cm (women) and 160 cm (men) upward
This is a large, well-powered dataset. It produces reliable normative reference values across the full adult lifespan.
How the Percentile Formula Works
The calculator converts your grip strength measurement into a z-score — a standardized value that describes your position relative to the mean of your peer group.
textz = (Your Score − Peer Group Mean) ÷ Peer Group Standard Deviation
That z-score is then converted into a percentile using a standard normal distribution. This tells you what percentage of your peer group scores below your result.
Limitations of This Calculator
Every tool has limitations. Here are the important ones to understand:
- Population: Data is from Germany. Results may differ slightly for populations with significantly different average body compositions
- Age range: The tool applies to ages 17–90 only
- Height range: Minimum heights apply — results outside these ranges may be less precise
- Measurement error: Accuracy depends on the correct dynamometer technique
- Device variation: Different dynamometer models may produce slightly different readings
- Single snapshot: One measurement captures one moment. Grip strength varies with fatigue, time of day, and hydration
Despite these limitations, the SOEP dataset is among the best available for grip strength population norms. This calculator gives you a more informed comparison than any simple chart or rule of thumb.
Frequently Asked Questions
Use a handgrip dynamometer. Stand upright with your elbow bent at 90 degrees. Squeeze as hard as possible for 3 to 5 seconds. Take three attempts per hand. Use the best score. Enter both hands into this calculator for your percentile ranking and peer group comparison.
Yes — for most adults, 40 kg is a solid grip strength score. For men under 50, it is around average. For men over 60, it is above average. For women of any age, 40 kg is well above average. Use the calculator for your precise percentile within your specific age and height group.
A good grip strength sits at or above the 50th percentile for your age, gender, and height. For men aged 30–50, that means roughly 40–50 kg. For women aged 30–50, around 25–32 kg. Scores decline with age — so the benchmark shifts lower as you get older.
Yes — 250 lbs equals approximately 113 kg, which is exceptional. This level exceeds most competitive strength athletes. Even elite powerlifters rarely exceed 130–160 kg. A score of 250 lbs would place virtually any adult in the 99th percentile regardless of age or gender.
Normal grip strength falls within one standard deviation of the mean for your peer group. For men aged 30–50, that is roughly 35–55 kg. For women aged 30–50, roughly 20–33 kg. However, normal varies significantly with age, height, and activity level — use the calculator for your precise range.
Grip strength peaks between ages 25 and 35 for most people. After 40, it declines gradually — typically 1–2% per year. After 65, the decline can accelerate. However, regular resistance training significantly slows this decline. Active older adults often maintain grip strength well above that of sedentary peers 10–15 years younger.
Common causes include physical inactivity, age-related muscle loss (sarcopenia), osteoarthritis, carpal tunnel syndrome, rheumatoid arthritis, vitamin D deficiency, diabetes-related nerve damage, and neurological conditions. Sudden or one-sided grip weakness warrants prompt medical evaluation.
Yes — extensively. Research links low grip strength to higher mortality risk, cardiovascular disease, frailty, sarcopenia, longer hospital stays, and slower surgical recovery. The landmark PURE study found every 5 kg drop in grip strength associated with 16% higher all-cause mortality risk.
The dominant hand is usually about 10% stronger than the non-dominant hand. A gap under 15% is normal. A gap above 15% may indicate an imbalance worth addressing through targeted training. Sudden one-sided weakness — especially in the non-dominant hand — can signal an underlying medical issue.
Accuracy depends on the measurement technique. With correct dynamometer use and standardized positioning, results are highly reliable. This calculator compares your score against real population data from 25,285 observations — giving you a meaningful, evidence-based percentile ranking rather than a rough estimate.
Related Calculators
These tools work well alongside the Grip Strength Calculator:
- Sarcopenia Risk Calculator — Assess full muscle loss risk using grip strength, walking speed, BMI, age, and skeletal muscle index
- BMI Calculator — Calculate your Body Mass Index for a broader body composition picture
- Body Fat Percentage Calculator — Understand how much of your weight comes from fat versus lean mass
- Frailty Index Calculator — Assess overall frailty risk using the clinical frailty scale framework
- Ideal Body Weight Calculator — Find your healthy weight target based on height, gender, and frame
- Lean Body Mass Calculator — Calculate your muscle, bone, and organ mass separately from body fat