Your Results Will Appear Here
Fill in your details above and click Calculate to see your SMI score, muscle breakdown and health insights.
EWGSOP2 Guidelines
Population Comparison
Personalised Recommendations
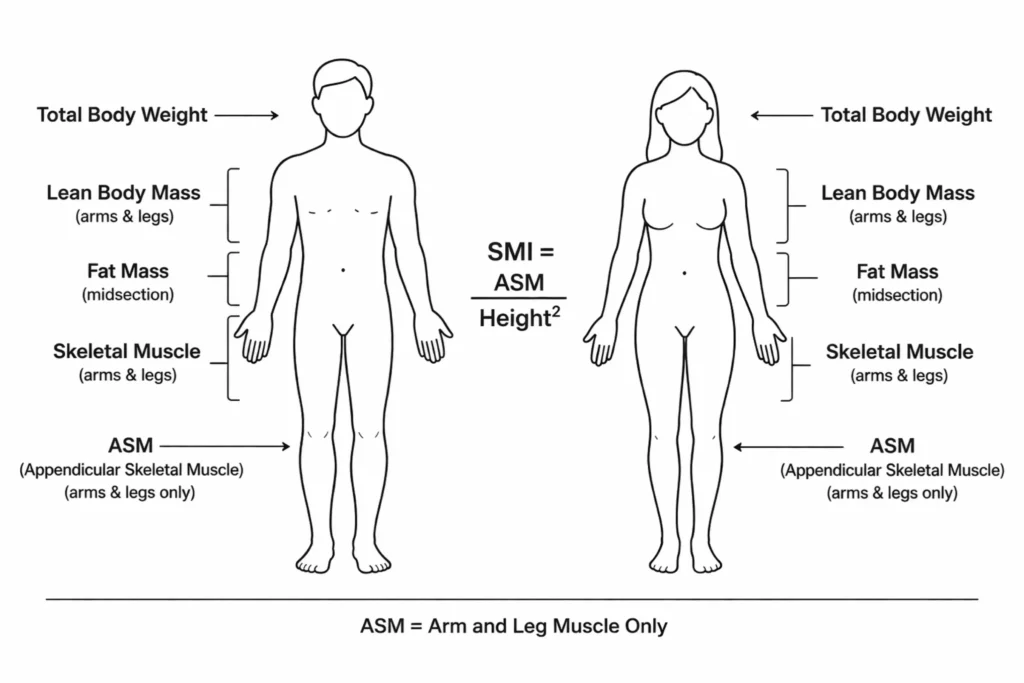
SMI = ASM (kg) / Height² (m²)
ASM = (0.244 × weight_kg) + (7.8 × height_m) – (0.098 × age) + sex_coefficient – 3.3
Male: LBM = (0.407 * W) + (0.267 * H_cm) – 19.2
Female: LBM = (0.252 * W) + (0.473 * H_cm) – 48.3
What Is Skeletal Muscle Index?
Skeletal Muscle Index, or SMI, is a number that tells you how much muscle you have in your arms and legs compared to your height.
That is really all it is. One number. Easy to calculate. Very useful to know.
Here is why it matters.
Most people check their weight on a scale. But your weight alone tells you nothing about how much of your body is muscle and how much is fat. Two people can weigh the same and look completely different, because one has more muscle and less fat.
SMI fixes that problem. It looks specifically at your skeletal muscle, the muscle you use to walk, lift things, climb stairs, and move your body- and compares it to your height.
The higher your SMI, the more muscle you have for your body size. The lower it is, the less muscle you have.
Researchers use SMI to find out if someone has too little muscle. When muscles get too low, it can cause serious health problems. This condition is called sarcopenia, a word that just means “not enough muscle.”
Why Your Muscle Mass Matters More Than You Think
Think of your muscles as your body’s engine.
Your muscles burn calories even when you are sitting still. They help your body use sugar from food properly. They keep your bones strong. They let you move freely without getting tired quickly.
When people do not have enough muscle:
- Their metabolism slows down
- Their bodies struggle to control blood sugar
- They feel tired more easily
- They are more likely to fall or get injured
- They find daily tasks harder as they get older
A 2015 study published in The Lancet followed 140,000 adults across 17 countries. It found that muscle strength, which directly connects to SMI, predicted how long people lived better than blood pressure did.
That is a big deal.
What Does SMI Actually Measure?
SMI measures the muscles in your arms and legs only. Not your stomach. Not your back. Just your limbs.
This group of muscles is called appendicular skeletal muscle mass (ASM). It sounds complicated, but the idea is simple. Your arm and leg muscles are the most useful ones for tracking your overall muscle health.
Scientists found that measuring only the limb muscles gives a very accurate picture of your overall muscle status. So that is what SMI uses.
How to Calculate SMI
The SMI Formula
SMI = ASM ÷ Height²
Where:
- ASM = the weight of muscle in your arms and legs (in kg)
- Height = your height in metres
- Result = your SMI in kg/m²
That is it. Simple division.
Step-by-Step: How to Calculate SMI
Step 1: Write down your height in metres
If you know your height in centimetres, divide by 100.
- Example: 175 cm ÷ 100 = 1.75 metres
If you know your height in feet and inches, multiply total inches by 0.0254.
- Example: 5 ft 9 in = 69 inches × 0.0254 = 1.75 metres
Step 2: Multiply your height by itself
This gives you height squared.
- Example: 1.75 × 1.75 = 3.0625
Step 3: Find your arm and leg muscle weight
This is the trickiest part. The most accurate way is a body scan called a DEXA scan. But most people do not have access to one.
The good news is you can estimate it using a simple formula. We cover this in the next section.
Step 4: Divide muscle weight by height squared
- Example: ASM of 27 kg ÷ 3.0625 = SMI of 8.82 kg/m²
Step 5: Check what your number means
Use the charts below to see if your SMI is low, normal, or high.
The Easy Formula to Estimate Your Muscle Weight at Home
You do not need a body scan to use the SMI calculator. You can estimate your arm and leg muscle weight using just your body weight, height, and age.
This method was developed by researcher Ian Janssen and his team and published in the Journal of Applied Physiology in 2000. It has been used in hundreds of studies since then.
The Janssen Formula:
ASM = (0.244 × body weight in kg) + (7.8 × height in metres) − (0.098 × age) + number for your sex − 3.3
Number for your sex:
- Men: add 1.4
- Women: add 0
Worked Example, Male
Details: Male, age 35, weight 80 kg, height 175 cm
- Height in metres: 175 ÷ 100 = 1.75 m
- Height squared: 1.75 × 1.75 = 3.0625
- ASM = (0.244 × 80) + (7.8 × 1.75) − (0.098 × 35) + 1.4 − 3.3
- ASM = 19.52 + 13.65 − 3.43 + 1.4 − 3.3 = 27.84 kg
- SMI = 27.84 ÷ 3.0625 = 9.09 kg/m²
- Result: Normal, Healthy ✅
Worked Example, Female
Details: Female, age 55, weight 62 kg, height 162 cm
- Height in metres: 162 ÷ 100 = 1.62 m
- Height squared: 1.62 × 1.62 = 2.6244
- ASM = (0.244 × 62) + (7.8 × 1.62) − (0.098 × 55) + 0 − 3.3
- ASM = 15.128 + 12.636 − 5.39 + 0 − 3.3 = 19.07 kg
- SMI = 19.07 ÷ 2.6244 = 7.27 kg/m²
- Result: Normal, Healthy ✅
Quick Unit Conversion Guide
| You Have | You Need | How to Convert |
|---|---|---|
| Pounds | Kilograms | Divide by 2.205 |
| Kilograms | Pounds | Multiply by 2.205 |
| Feet + Inches | Metres | Total inches × 0.0254 |
| Centimetres | Metres | Divide by 100 |
What Is a Good SMI Score?
A good SMI is between 7.0 and 9.5 for men, and between 5.5 and 7.5 for women.
These numbers come from large research studies and are used by doctors and scientists around the world.
Let us break it down simply.
What Is an Ideal SMI?
Your ideal SMI depends on your age and sex. Younger adults should aim for the higher end of the healthy range. As you get older, staying inside the healthy range at all is what matters most.
| Who You Are | Ideal SMI Target |
|---|---|
| Men aged 20–40 | 8.5 to 9.5 kg/m² |
| Men aged 41–60 | 8.0 to 9.0 kg/m² |
| Men aged 60+ | 7.5 to 8.5 kg/m² |
| Women aged 20–40 | 6.5 to 7.5 kg/m² |
| Women aged 41–60 | 6.0 to 7.0 kg/m² |
| Women aged 60+ | 5.5 to 6.5 kg/m² |
What Is the Average SMI?
Here is what the average person scores based on age:
| Group | Average SMI |
|---|---|
| Men aged 20–39 | About 8.5 kg/m² |
| Men aged 40–59 | About 8.0 kg/m² |
| Men aged 60–79 | About 7.2 kg/m² |
| Men aged 80+ | About 6.8 kg/m² |
| Women aged 20–39 | About 6.5 kg/m² |
| Women aged 40–59 | About 6.1 kg/m² |
| Women aged 60–79 | About 5.6 kg/m² |
| Women aged 80+ | About 5.2 kg/m² |
You can see that SMI goes down as people get older. This happens because people naturally lose muscle as they age, especially if they are not active. The drop starts slowly around age 30 and speeds up after 60.
What Is a High SMI?
A high SMI is above 9.5 for men and above 7.5 for women.
This is a good thing. Having a high SMI means you have strong, healthy muscle mass for your body size. People with high SMI tend to:
- Have a faster metabolism
- Control their blood sugar better
- Have stronger bones
- Stay independent longer as they age
- Have a lower risk of heart problems
Most people with a high SMI are either athletes or people who have been strength training consistently for years.
What Does a Low SMI Mean?
A low SMI is below 7.0 for men and below 5.5 for women.
This is a warning sign. It does not mean something terrible will happen tomorrow. But it does mean your body has less muscle than it should. Over time, this creates problems with:
- Energy levels
- Blood sugar control
- Bone strength
- Balance and mobility
- Overall health as you age
If your SMI is low, the good news is that you can improve it. We explain how later in this article.
SMI Chart for Men and Women
Men: Full SMI Chart
| Category | SMI Score | What It Means |
|---|---|---|
| Athletic | Above 10.0 | Excellent muscle — keep it up |
| Above Average | 9.5 to 10.0 | Great muscle health |
| Normal | 7.0 to 9.5 | Healthy range — good work |
| Borderline Low | 6.0 to 7.0 | Getting low — time to act |
| Too Low | Below 6.0 | Significantly low muscle |
Women: Full SMI Chart
| Category | SMI Score | What It Means |
|---|---|---|
| Athletic | Above 8.0 | Excellent muscle — keep it up |
| Above Average | 7.5 to 8.0 | Great muscle health |
| Normal | 5.5 to 7.5 | Healthy range — good work |
| Borderline Low | 4.5 to 5.5 | Getting low — time to act |
| Too Low | Below 4.5 | Significantly low muscle |
What Score Do You Need to Avoid Sarcopenia?
Sarcopenia is the medical term for having too little muscle. Three major research groups have set these minimum scores:
| Research Group | Men — Minimum | Women — Minimum |
|---|---|---|
| EWGSOP2 (Europe, 2019) | 7.0 kg/m² | 5.5 kg/m² |
| FNIH Project (USA, 2014) | 7.23 kg/m² | 5.67 kg/m² |
| AWGS (Asia, 2019) | 7.0 kg/m² | 5.4 kg/m² |
If your SMI falls below these numbers, it is worth speaking to a doctor or health professional. Not because something is definitely wrong, but because it is worth knowing.
SMI for Men
What Is a Normal SMI for Men?
For men, a normal SMI is between 7.0 and 9.5 kg/m².
This range was first described by researcher Richard Baumgartner and his team in a 1998 study. Since then, it has been confirmed by many other researchers across different countries.
Men naturally have higher SMI scores than women. This is mainly because of testosterone, the hormone that helps build muscle. Men also tend to have larger muscle fibres on average.
Is 40 Percent Muscle Mass Good for a Man?
Yes. 40% skeletal muscle mass is excellent for a man.
Most men have somewhere between 33% and 36% skeletal muscle. So 40% puts you well above average. It usually means you strength train regularly and eat enough protein.
Here is a simple guide for men:
| Rating | Skeletal Muscle % |
|---|---|
| Excellent | Above 40% |
| Good | 33% to 39% |
| Average | 29% to 32% |
| Below Average | Below 29% |
Note: skeletal muscle percentage and SMI are related but slightly different. SMI compares your muscle to your height. Muscle percentage compares it to your total weight. Both are useful. Use our [muscle mass percentage calculator] to check both.
How Men Lose Muscle Over Time
Men start losing muscle slowly from around age 30. The loss speeds up significantly after age 50. Research shows men can lose between 1% and 3% of their muscle every year after 50 if they are not actively working to keep it.
This is why checking your SMI regularly, especially after 40, is a smart habit.
SMI for Women
What Is a Normal SMI for Women?
For women, a normal SMI is between 5.5 and 7.5 kg/m².
Women have lower SMI scores than men by nature. This is normal. The important thing is staying within the healthy range for women specifically.
Low SMI in women is linked to weaker bones, slower metabolism, and a higher risk of health problems later in life. That is why tracking muscle mass for women is just as important as for men — even though the numbers look different.
Is 38% Muscle Mass Good for a Woman?
Yes. 38% skeletal muscle mass is excellent for a woman.
The average woman has about 25% to 32% skeletal muscle. Getting to 38% takes real effort, regular strength training, and good protein intake. Women who reach this level tend to feel stronger, have more energy, and maintain a healthy weight more easily.
Here is a simple guide for women:
| Rating | Skeletal Muscle % |
|---|---|
| Excellent | Above 36% |
| Good | 30% to 35% |
| Average | 25% to 29% |
| Below Average | Below 25% |
Use our [skeletal muscle calculator for females] to find your percentage quickly.
Two Things That Affect Muscle Mass in Women
Pregnancy
During pregnancy, muscle mass can drop temporarily. This is normal. After having a baby, building muscle back up through gentle exercise and good food makes a real difference. Do not check your SMI during or right after pregnancy and expect it to reflect your normal baseline.
Menopause
This is the bigger one. When estrogen levels drop during menopause, women lose muscle faster. Research by Maltais and colleagues (2009) showed that post-menopausal women have noticeably less arm and leg muscle than pre-menopausal women of the same age, even when they exercise the same amount.
Women over 50 should pay extra attention to their SMI and prioritise strength training. It is one of the most powerful tools available for maintaining health after menopause.
How to Calculate Skeletal Muscle Mass
There are three main ways to find out your skeletal muscle mass in kg. Here they are, from most accurate to most accessible.
Method 1: DEXA Scan
A DEXA scan is a type of body imaging that uses low-level X-rays to measure exactly how much muscle, fat, and bone you have, and where it is in your body.
It gives you your ASM (arm and leg muscle mass) directly in kilograms. This is the gold standard method. It is the most accurate way to calculate your SMI.
DEXA scans are available at hospitals, some gyms, and private health clinics. They cost roughly £50 to £150 in the UK or $75 to $200 in the USA.
Method 2: BIA Smart Scale or Device
BIA stands for bioelectrical impedance analysis. It sounds fancy, but it just means the device sends a tiny, harmless electrical signal through your body. Muscle holds more water than fat, so it conducts electricity differently. The device uses this to estimate how much muscle you have.
You can find BIA in:
- Smart bathroom scales (Tanita, Withings, Eufy)
- Handheld devices
- InBody machines at gyms and clinics
BIA is less accurate than DEXA but much more accessible. For the best results with a BIA scale:
- Weigh yourself first thing in the morning
- Go to the bathroom first
- Do not eat or drink anything yet
- Do not exercise beforehand
- Do it at the same time every day for consistent tracking
Method 3: The Janssen Formula (No Equipment Needed)
This is what the calculator at the top of this page uses. You just need your weight, height, and age.
The formula is:
ASM = (0.244 × weight in kg) + (7.8 × height in metres) − (0.098 × age) + 1.4 (men) or 0 (women) − 3.3
It gives you a good estimate of your arm and leg muscle weight. Not perfect, but accurate enough for tracking and understanding where you stand.
How to Calculate Skeletal Muscle Mass from Lean Body Mass
If you already know your lean body mass from a smart scale, you can roughly estimate your ASM like this:
Estimated ASM = Lean Body Mass × 0.45 × 0.72
This works because arm and leg muscles make up about 72% of total skeletal muscle, which makes up about 45% of lean body mass.
This is a rough estimate. The Janssen formula or a DEXA scan will give you a better number.
What Is Lean Body Mass?
Lean body mass (LBM) is everything in your body that is not fat.
This includes your muscles, bones, organs, blood, and water. It is not the same as just your muscles. Your bones and organs are heavy too.
Think of it this way:
Total body weight = Fat mass + Lean body mass
If you weigh 75 kg and have 20% body fat, you have 15 kg of fat and 60 kg of lean body mass.
What Is the LBM Formula?
The most commonly used formula is called the Boer Formula (1984). It only needs your weight and height:
For men:
LBM = (0.407 × weight in kg) + (0.267 × height in cm) − 19.2
For women:
LBM = (0.252 × weight in kg) + (0.473 × height in cm) − 48.3
Can You Calculate LBM at Home?
Yes. You can calculate LBM at home using just your weight and height with the Boer formula above. No equipment needed.
Example: Female, 65 kg, 165 cm:
- LBM = (0.252 × 65) + (0.473 × 165) − 48.3
- LBM = 16.38 + 78.05 − 48.3
- LBM = 46.1 kg
You can also use a BIA smart scale. It gives you LBM directly, though results shift slightly based on your hydration. Use our [lean body mass calculator] to get your number without doing the maths yourself.
LBM vs SMI: What Is the Difference?
| LBM | SMI | |
|---|---|---|
| What it counts | All non-fat tissue | Arm and leg muscle only |
| Includes bones? | Yes | No |
| Includes organs? | Yes | No |
| Best used for | Estimating metabolism | Checking muscle health |
| Normalised for height? | No | Yes |
Both numbers are useful. They just answer different questions.
Does 10 lbs of Fat Look Like 10 lbs of Muscle?
No, not even close.
Muscle is much denser than fat. This means 10 lbs of muscle takes up about 18% less space in your body than 10 lbs of fat.
Imagine 10 lbs of fat as a big, soft, wobbly blob. Then imagine 10 lbs of muscle as a small, firm, compact brick. Same weight. Very different size.
This is why two people can weigh the same on the scale and look completely different. The one with more muscle looks leaner and more defined. The one with more fat looks larger and softer.
This is also why the number on your scale is not the best measure of your health or your body. SMI and [body fat percentage] give you a much better picture.
SMI vs BMI: Which One Is Better?
What Is Wrong With BMI?
BMI has been around for over 150 years. It is simple, just your weight divided by your height squared. And that is also its problem.
BMI cannot tell the difference between muscle and fat.
A 90 kg athlete who is 180 cm tall has a BMI of 27.8, which says “overweight.” But his SMI might be 9.6, which says “above average muscle.” BMI calls him unhealthy. SMI tells the truth.
On the other side, an older woman might have a BMI of 23, which says “healthy weight.” But if she has lost a lot of muscle over the years and replaced it with fat, her SMI might be 4.9, which says “borderline sarcopenic.” BMI misses this completely. SMI catches it.
In 2023, the American Medical Association officially said that BMI alone is not a reliable health measurement and should be used alongside other body composition tools. SMI is exactly that kind of tool.
Side-by-Side Comparison
| Feature | SMI | BMI |
|---|---|---|
| Measures muscle | Yes | No |
| Tells fat from muscle | Yes | No |
| Works for athletes | Yes | Often wrong |
| Detects muscle loss | Yes | No |
| Gender-specific scores | Yes | No |
| Age-adjusted scores | Yes | No |
| Equipment needed | BIA or formula | None |
Which Should You Use?
Use both; they answer different questions.
Check your BMI to get a quick sense of your weight-to-height ratio. Then check your SMI to understand whether that weight is coming from muscle or fat. Together, they give you a much clearer picture than either one alone.
You can also check your [waist-to-hip ratio calculator] to see how your body distributes fat, another useful piece of the puzzle.
Low SMI Warning Signs
How do you know if your SMI might be getting low before you even calculate it?
- You find it hard to get up from a chair or sofa without pushing off with your hands
- Climbing stairs feels more tiring than it used to
- Carrying shopping bags or heavy objects feels much harder
- You feel your balance is not as good as before
- You get tired more quickly during normal activities
- Jars, bottles, or taps feel harder to open than they used to
Watch for these signs:
Physical signs:
Body composition signs:
- You have lost weight, but your body looks softer, not leaner
- Your clothes fit differently, even though your weight has not changed much
- You feel weaker even though your weight is the same
Who is most at risk:
- People over 60 who do little exercise
- People who have been ill or in bed for a long time
- People on very low-calorie diets without strength training
- Women going through menopause
- People are losing weight quickly through medication like Zepbound or Ozempic
If you notice three or more of these signs, use the calculator above to check your SMI. Then speak to your doctor if the result is low.
Common Mistakes When Measuring SMI
Mistake 1: Measuring BIA After Exercise or a Big Meal
Your body’s water levels change after exercise or eating. This changes your BIA reading. Always measure BIA first thing in the morning, before eating, drinking, or exercising.
Mistake 2: Mixing Up LBM and Muscle Mass
If your smart scale shows your lean body mass, that number includes your bones and organs. It is not the same as your skeletal muscle. Do not use your LBM number as your ASM in the SMI formula you will get a number that is too high.
Mistake 3: Using the Wrong Reference Chart
Men and women have completely different SMI ranges. Make sure you are looking at the right chart for your sex. Using male ranges to judge a woman’s SMI will make most women look sarcopenic when they are not.
Mistake 4: Only Checking Once
A single SMI reading is useful. But the real value comes from checking every 3 to 6 months. This shows you whether your muscle is growing, stable, or declining, and whether what you are doing is actually working.
Mistake 5: Worrying About Weight Instead of SMI
Many people try to lose weight and succeed, but lose muscle along the way. This can actually lower your SMI and make your health worse, even though the scale shows a smaller number. Tracking SMI alongside your weight gives you the full picture.
Mistake 6: Waiting Until You Are Old
Muscle loss begins slowly around age 30. By the time you are 60 and notice problems, you may have been losing muscle for 30 years. Starting to track and protect your SMI in your 30s or 40s is the smartest move.
How to Improve Your SMI
Good news, low SMI is fixable. Here is what actually works.
1. Strength Training
This is the most important thing you can do. Lifting weights or doing resistance exercises tells your body to build and keep muscle.
You do not need to become a bodybuilder. Even 2 to 3 sessions per week make a measurable difference.
Simple starting plan:
| Experience Level | Sessions Per Week | What to Do |
|---|---|---|
| Beginner | 3 times | Full body workouts, bodyweight or light weights |
| Intermediate | 3 to 4 times | Mix of machines and free weights |
| Advanced | 4 to 5 times | Progressive overload with heavier weights |
The key rule is progressive overload, gradually lifting a little more weight or doing a few more reps over time. Your muscles grow when they are challenged. Use our [one rep max calculator] to help plan your training intensity.
2. Eat Enough Protein
Protein is what your body uses to build muscle. Without enough protein, even the best training will not build much muscle.
How much protein do you need?
| Who You Are | Daily Protein Target |
|---|---|
| Not very active | 0.8g per kg of body weight |
| Moderately active | 1.2 to 1.6g per kg |
| Over 60 years old | 1.6 to 2.0g per kg |
| Actively building muscle | 1.6 to 2.2g per kg |
| On weight-loss medication | At least 1.6 to 2.0g per kg |
Spread your protein across 3 to 5 meals per day. Aim for 25 to 40g of protein per meal. Good sources include eggs, chicken, fish, Greek yoghurt, cottage cheese, lentils, and protein shakes.
Use our [protein intake calculator] to find your exact daily target.
3. Be Consistent
This is the one people always skip over. One good week of training and eating well does nothing. Six months of consistent effort change everything.
Before and After Example:
A 52-year-old woman, 65 kg, 163 cm, did 3 strength training sessions per week and increased her protein intake for 6 months. Here is what changed:
| Measurement | Before | After 6 Months |
|---|---|---|
| ASM (arm and leg muscle) | 17.0 kg | 18.8 kg |
| SMI | 6.39 kg/m² | 7.07 kg/m² |
| Category | Borderline Low | Normal |
| Muscle % | 26.2% | 28.9% |
She went from borderline low to the normal healthy range, just from consistent training and better protein intake. No special equipment. No extreme diet.
Body Composition Related Tools:
1. Lean Body Mass (LBM) Calculator
2. Body Fat Percentage Calculator
3. Muscle Mass Calculator
4. Waist-to-Hip Ratio Calculator
5. Ideal Body Weight Calculator
Frequently Asked Questions
Divide your arm and leg muscle weight (ASM) by your height in metres squared. The formula is SMI = ASM ÷ Height². If you do not know your ASM, use this estimate: ASM = (0.244 × weight kg) + (7.8 × height m) − (0.098 × age) + 1.4 (men) or 0 (women) − 3.3.
A good SMI is 7.0 to 9.5 for men and 5.5 to 7.5 for women (measured in kg/m²). These ranges mean you have a healthy amount of muscle for your height. Values above these ranges are even better.
For men aged 20 to 40, aim for 8.5 to 9.5 kg/m². For women aged 20 to 40, aim for 6.5 to 7.5 kg/m². As you get older, staying inside the healthy range at all becomes the main goal.
The average SMI for men aged 20 to 39 is about 8.5 kg/m². For women the same age, it is about 6.5 kg/m². Both numbers drop with age as people naturally lose muscle over time.
A high SMI is above 9.5 for men and above 7.5 for women. This is a good sign. It means you have more muscle than average for your height. Most people with a high SMI strength train regularly.
SMI is not measured in kg alone. It is measured in kg/m², which is kg divided by metres squared. The kg part comes from your ASM (muscle weight). Dividing by height squared makes it fair to compare people of different heights.
Use the Janssen formula: ASM = (0.244 × weight kg) + (7.8 × height m) − (0.098 × age) + 1.4 (men) or 0 (women) − 3.3. Or get a DEXA scan or BIA reading for a direct measurement. Our calculator at the top of this page does this automatically.
Yes. Use the Boer formula. For men: LBM = (0.407 × weight kg) + (0.267 × height cm) − 19.2. For women: LBM = (0.252 × weight kg) + (0.473 × height cm) − 48.3. You just need your weight and height.
The most used formula is the Boer Formula. Men: LBM = (0.407 × W) + (0.267 × H) − 19.2. Women: LBM = (0.252 × W) + (0.473 × H) − 48.3. W is weight in kg, and H is height in cm.
Weigh yourself and measure your height. Then plug those numbers into the Boer formula for your sex. Or use our [lean body mass calculator] to get the answer instantly without any maths.
Yes. 38% is good to excellent for both men and women. The average is 25 to 36%. For women, 38% is in the excellent category. For men, it is in the good category. Both reflect a healthy, well-muscled body.
Yes, 38% is excellent for a woman. Most women average 25 to 32% skeletal muscle. Reaching 38% usually means you lift weights regularly and eat good amounts of protein. Women at this level tend to feel stronger and have better energy.
Men should aim for 33% to 40%. Women should aim for 28% to 36%. If you are below 29% (men) or 24% (women), your muscle mass is on the lower side, and it is worth focusing on strength training and protein.
Higher is better, up to what you can naturally achieve through training. More muscle means faster metabolism, better blood sugar, stronger bones, and a lower risk of disease. Low muscle mass is linked to worse health outcomes, especially as you get older.
Yes. 40% is excellent for a man. The average is around 33 to 36%. Reaching 40% takes consistent training and good nutrition. Men at this level typically have strong metabolism, good energy, and lower health risks.
Yes, muscle loss is possible on Zepbound (tirzepatide) and similar medications like Ozempic. These drugs reduce appetite heavily, which can cause rapid weight loss. But if protein and exercise are not prioritised, some of that lost weight comes from muscle, not just fat. Tracking your SMI while on these medications is smart. Aim for 1.6 to 2.0g of protein per kg of body weight and keep strength training.
No. 20% body fat is not chubby. For men, 20% is average to acceptable. For women, 20% is actually quite lean; the healthy range for women is typically 21 to 33%. Body fat percentage should always be looked at alongside muscle mass for the full picture
A woman with 22% body fat typically looks lean and toned. Her arms and legs show some muscle definition. Her stomach is fairly flat but not heavily defined. This sits at the lower end of the healthy range for women and is a sign of good fitness.
No, they look very different. Muscle is denser than fat, so 10 lbs of muscle takes up much less space. Fat is soft and bulky. Muscle is compact and firm. This is why two people at the same weight can look completely different depending on their body composition.
Yes. You can use a BIA smart scale, skinfold calipers, or a circumference-based method. None are as precise as a DEXA scan, but they work well for tracking changes over time. Use our [body fat percentage calculator] for an estimate based on your measurements.
No. At 5’4″ and 140 lbs, your BMI is about 24.0 — which is in the healthy range. That said, BMI does not tell you about muscle vs fat. Two people can weigh 140 lbs and look very different depending on their body composition. Check your SMI and [body fat percentage] for a fuller picture.
Someone with 20% body fat and high muscle mass looks athletic and defined. Muscle shape is visible in the arms, shoulders, and legs. The body looks solid and toned rather than soft. This is different from someone with 20% body fat and low muscle, who may look average or soft despite the same fat percentage.
Formula Sources
SMI Formula:
Janssen I, et al. (2000) — Journal of Applied Physiology
Sarcopenia Cutoff Values:
EWGSOP2, Cruz-Jentoft AJ, et al. (2019) — Age and Ageing
FNIH Sarcopenia Project — Studenski SA, et al. (2014)
AWGS, Chen LK, et al. (2020)
Lean Body Mass Formula:
Boer P. (1984), American Journal of Physiology
Population Reference Ranges:
Baumgartner RN, et al. (1998), American Journal of Epidemiology
Results from this calculator are estimates based on the Janssen (2000) formula. Individual results may vary. This tool is for informational purposes only.