The Sarcopenia Risk Calculator is a free, point-based screening tool that estimates how likely you are to have sarcopenia, the slow, age-related loss of muscle mass, strength, and physical function. It gives you a clear risk score in under two minutes using five simple inputs: age, BMI, grip strength, walking speed, and skeletal muscle index.
Sarcopenia Risk Calculator
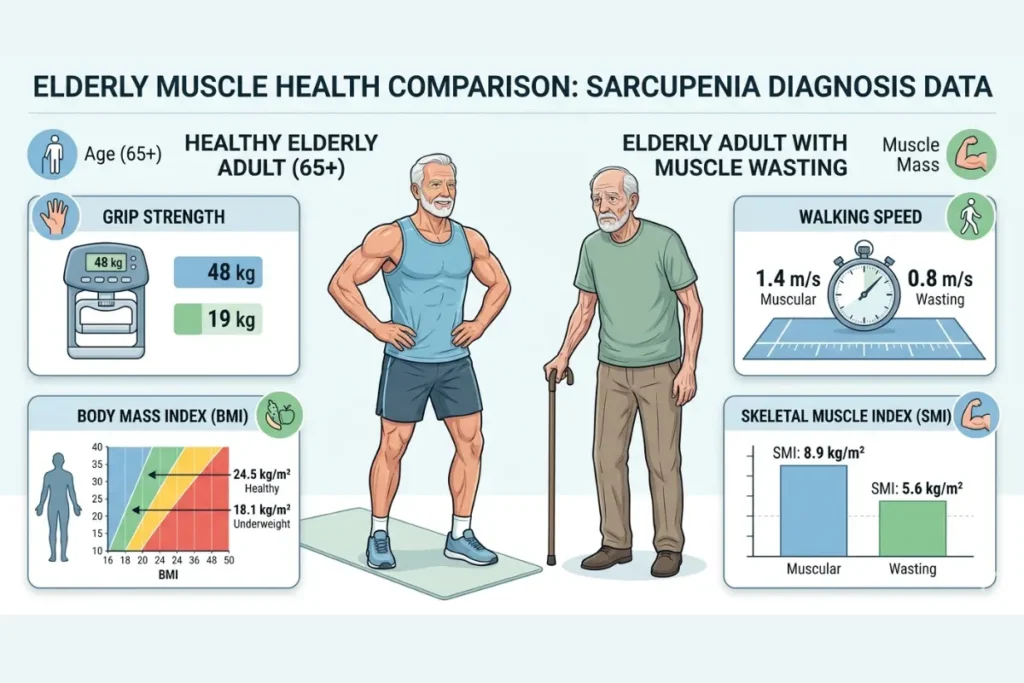
Screening tool for muscle mass, strength, and physical performance assessment.
Enter your measurements above to see the clinical risk assessment.
Component Scores
Note: This tool uses the standardized Sarcopenia scoring protocol. A moderate or high risk result suggests a need for clinical consultation with a healthcare professional.
Key Takeaways
- Sarcopenia affects 10–40% of adults over 60; most don’t know they have it until function is already lost
- This calculator uses 5 inputs: age, BMI, grip strength, walking speed, and skeletal muscle index (SMI)
- Scores run from 0 to 10 — the higher your score, the higher your muscle loss risk
- The tool is built around EWGSOP2 and AWGS 2019 diagnostic frameworks — the two gold standards in sarcopenia research
- Progressive resistance training and adequate protein intake are the most effective interventions — but timing matters
- Catching muscle loss early can meaningfully protect your independence, mobility, and quality of life
What Is the Sarcopenia Risk Calculator?
The Sarcopenia Risk Calculator is a free, point-based screening tool that estimates how likely you are to have sarcopenia — the slow, age-related loss of muscle mass, muscle strength, and physical function.
It gives you a numbered score. That score is based on five things that research links to muscle loss consistently: your age, your BMI, your grip strength, how fast you walk, and your skeletal muscle index.
Think of it like a check engine light for your muscles. It doesn’t tell you exactly what’s wrong. But it tells you clearly when something deserves attention.
This tool is built on two widely accepted clinical frameworks. The first is the EWGSOP2 criteria — published by the European Working Group on Sarcopenia in Older People.
The second is the AWGS 2019 guidelines — from the Asian Working Group for Sarcopenia. Both groups looked at thousands of patients and identified the same core message: catching muscle loss early changes outcomes dramatically.
The calculator is especially useful if you are:
- 65 or older and want to understand your muscle health
- Noticing muscle weakness or a slower walking speed
- Managing a chronic illness that causes muscle wasting conditions
- Looking for a quick body composition analysis before seeing a specialist
It is not a replacement for a clinical visit. But it is a fast, evidence-informed starting point that gives you real data to work with.
How to Use This Calculator (Step-by-Step)
Using this tool takes less than two minutes. The key is getting each measurement right — small errors add up and shift your score. Here is exactly what you need and how to do each step.
Step 1: Enter Your Age
Enter your current age. The scoring system weights different age ranges differently because muscle mass loss per decade accelerates as you get older. The biology is clear on this: adults lose approximately 3–8% of muscle mass per decade from age 30, and that rate picks up speed after 60.
| Age | Points |
|---|---|
| Under 65 | 0 |
| 65–74 years | 1 |
| 75 years or older | 2 |
Step 2: Enter Your BMI
BMI stands for Body Mass Index. It is a ratio of your weight to your height squared.
Formula:
textBMI = Weight (kg) ÷ Height (m)²
Example: You weigh 65 kg and are 1.70 m tall.
textBMI = 65 ÷ (1.70 × 1.70) = 65 ÷ 2.89 = 22.5
That puts you in the 18.5–24.9 range, which scores 1 point on this calculator.
| BMI Range | Points |
|---|---|
| 25.0 or above | 0 |
| 18.5 – 24.9 | 1 |
| Below 18.5 | 2 |
A low BMI often indicates low lean muscle mass and is a reliable red flag for nutritional assessment and concerns about muscle loss. This is especially true in older adults, where a BMI under 22 has been associated with poorer muscle health outcomes.
Step 3: Measure Your Grip Strength
Grip strength measurement is one of the most clinically researched single markers of overall muscle health. You measure it using a handgrip dynamometer, a small, handheld device that reads the force of your squeeze.
How to measure grip strength at home (standard method):
- Sit upright in a chair with your feet flat on the floor
- Hold the dynamometer in your dominant hand
- Keep your elbow bent at 90 degrees and your wrist in a neutral position
- Squeeze as hard as you can for 3 full seconds
- Rest for 60 seconds between attempts
- Take the best result from 3 attempts
Scoring by gender:
| Gender | 2 Points | 1 Point | 0 Points |
|---|---|---|---|
| Male | Below 27 kg | 27–35 kg | Above 35 kg |
| Female | Below 16 kg | 16–20 kg | Above 20 kg |
Step 4: Measure Your Walking Speed
Walking speed — also called gait speed — is a powerful indicator of functional decline in older adults. Clinicians use it because slow walking reflects more than just tired legs.
It reflects reduced muscle strength, poor balance, limited cardiovascular reserve, and declining neurological coordination simultaneously.
How to measure your walking speed (4-meter gait speed test):
- Mark a flat, straight 4-meter distance on the floor with tape
- Stand at the start line
- Walk at your normal, comfortable pace — do not rush
- Have someone time you from the first step to crossing the end line
- Calculate your speed using this formula:
textWalking Speed (m/s) = 4 ÷ Time in seconds
Example: You walk 4 meters in 5.5 seconds.
text4 ÷ 5.5 = 0.73 m/s → 2 points (high risk range)
Scoring:
| Walking Speed | Points |
|---|---|
| Below 0.8 m/s | 2 |
| 0.8 – 1.0 m/s | 1 |
| Above 1.0 m/s | 0 |
Normal walking speed by age declines predictably. Adults in their 40s average 1.2–1.4 m/s. By the 70s, speeds below 1.0 m/s were common. Below 0.8 m/s, the risk of falls, hospitalizations, and loss of independence rises significantly.
Step 5: Enter Your Skeletal Muscle Index (SMI)
The Skeletal Muscle Index is the most direct measurement in this calculator. It tells you how much muscle you actually have relative to your body size.
Formula:
textSMI = Appendicular Skeletal Muscle Mass (kg) ÷ Height² (m²)
Appendicular skeletal muscle mass means the muscle in your arms and legs, not your trunk. You get this number from a body composition scan.
The most accurate method is dual-energy X-ray absorptiometry (DXA). A widely available alternative is bioelectrical impedance analysis (BIA), offered at many gyms, sports clinics, and hospitals.
Scoring by gender:
| Gender | 2 Points | 1 Point | 0 Points |
|---|---|---|---|
| Male | Below 7.0 kg/m² | 7.0–8.5 kg/m² | Above 8.5 kg/m² |
| Female | Below 5.5 kg/m² | 5.5–6.5 kg/m² | Above 6.5 kg/m² |
Step 6: Read Your Total Score
Add all five scores together. The maximum possible score is 10. This calculator does the addition automatically and places your result in the correct risk category.
Understanding Your Score
Your score places you in one of three risk categories. Each one comes with a specific set of next steps — because what you do with this information matters more than the number itself.
Low Risk: Score 0 to 3
A score between 0 and 3 means your muscle health indicators look relatively healthy right now. This is good news, but it does not mean you can ignore the issue going forward.
Muscle mass loss per decade starts in your 30s. Most people don’t notice it until significant loss has already happened, because day-to-day life rarely demands maximum muscle output.
By the time your walking speed slows or your grip weakens noticeably, you may have already lost 20–30% of your peak muscle mass.
Low risk means you are ahead of the curve. Your job is to stay there.
What to do at this stage:
- Keep up regular physical activity, especially strength-based movement
- Make sure your daily protein intake meets the needs of your age (more on this below)
- Reassess this calculator annually or sooner if your health changes
- Watch for early warning signs: slower walking, difficulty opening jars, less stamina on stairs
Moderate Risk: Score 4 to 6
A score of 4 to 6 means one or more areas of your muscle health need real attention. You may already be experiencing early signs of muscle strength decline — even if they feel minor or easy to explain away.
This is the most important score range in this tool. It is the stage where intervention works best. Research consistently shows that structured resistance training and protein optimization can slow or partially reverse muscle loss when started at this stage, but that window does not stay open indefinitely.
Waiting is the wrong choice at moderate risk.
What to do:
- Start progressive resistance training — 2 to 3 sessions per week
- Review your daily protein intake with a dietitian
- Ask your doctor to investigate modifiable causes — vitamin D deficiency, muscle loss, thyroid dysfunction, low testosterone, and muscle mass issues are all treatable
- Request a full body composition analysis using DXA or bioelectrical impedance analysis (BIA)
- Consider completing the SARC-F questionnaire as a supplementary self-screen
High Risk: Score 7 to 10
A score of 7 or above is serious. At this level, sarcopenia may already be significantly affecting your physical function and independence. Falls risk in elderly adults is sharply elevated.
The connection between high-scoring individuals and conditions like osteoporosis, sarcopenia (osteosarcopenia), type 2 diabetes sarcopenia, heart failure, muscle loss, and COPD muscle wasting is clinically well documented.
This score calls for immediate action, not next month, now.
What to do urgently:
- See your doctor or a geriatric specialist as soon as possible
- Request a referral to physical therapy for sarcopenia
- Get a comprehensive nutritional assessment for muscle loss
- Ask about dual-energy X-ray absorptiometry (DXA) for precise muscle mass measurement
- Discuss whether blood tests, including albumin levels, sarcopenia markers, and vitamin D status, are appropriate
- Ask about the creatinine height index as a biochemical measure of muscle mass
High-risk individuals benefit most from a multidisciplinary geriatric care approach, a physician, dietitian, and physical therapist working together as a coordinated team. Solo interventions at this level rarely produce the outcomes that team-based care achieves.
Scoring Criteria Explained
Each of the five inputs in this calculator was selected because it independently predicts sarcopenia risk, and each one tells a different part of the story. Here is what each measurement actually reflects and why it matters.
Age and Sarcopenia Risk
Age is the single largest non-modifiable risk factor for muscle loss. It is also the one factor everyone reading this has in common. Muscle mass loss per decade begins around age 30 and stays relatively gradual until about 60. After that, the rate accelerates.
By age 80, research estimates that some individuals have lost up to 50% of their peak skeletal muscle mass. Sarcopenia prevalence statistics reflect this reality; studies consistently show sarcopenia affecting around 10% of adults in their 60s and rising to 30–40% in those over 80.
What is happening biologically is not simply disuse. Aging changes the hormonal environment, with testosterone and growth hormone decline. Motor neurons that control fast-twitch muscle fibers degenerate.
Chronic low-grade inflammation accelerates muscle protein breakdown. Physical inactivity, muscle loss, and all of these processes add to all of these processes. The cumulative effect is what this calculator is designed to detect early.
BMI and Muscle Loss
Low BMI scores higher on this calculator — but the relationship between BMI and sarcopenia is more complex than it looks. Understanding that complexity helps you interpret your results accurately.
A BMI under 18.5 is a consistent red flag. In older adults, it usually signals inadequate nutrition, chronic disease-related muscle wasting, or both. This is why low BMI appears in virtually every sarcopenia screening protocol and nutritional assessment muscle loss framework.
But here is what many people miss: sarcopenic obesity, where someone has normal or even high body weight but critically low lean muscle mass hidden beneath fat, is increasingly common.
A person can have a BMI of 24 and be deeply sarcopenic. Their weight is maintained by fat, not muscle.
This is exactly why BMI alone is never enough for a complete muscle mass assessment. It is one piece of information, useful, but incomplete without the other four inputs in this tool.
Grip Strength: What Your Score Means
Grip strength measurement is backed by decades of research, and it consistently surprises people. Low grip strength does not just mean weak hands. It reflects whole-body muscle strength decline.
The condition, sometimes called dynapenia, loss of muscle strength independent of measurable muscle mass loss, is often first detected through grip strength testing. This is clinically significant because dynapenia can precede visible muscle loss by years, making it an early detection window.
Studies link poor grip strength to longer hospital stays, slower surgical recovery, higher cardiovascular risk, and increased mortality in older adults.
That is why a handgrip dynamometer test sits at the center of every major sarcopenia screening protocol, including EWGSOP2, which now places low grip strength as the primary diagnostic criterion, even before low muscle mass.
If you don’t have access to a dynamometer, many pharmacies, gyms, and physiotherapy clinics have them. It is worth getting tested.
Walking Speed: Gait Speed Assessment
Walking speed is one of the most deceptively simple and deeply informative tests in geriatric medicine. Researchers have called it the “sixth vital sign”, and there is good reason for that.
The 4-meter gait speed test used in this calculator is the most widely used clinical version. Some settings use 6-meter or 10-meter tracks. The 6-minute walk test is a related but more demanding assessment used in cardiac and pulmonary rehabilitation settings.
What makes gait speed so powerful as a marker of functional decline in older adults is what it demands from your body simultaneously: muscle strength in both legs, coordination between leg and trunk muscles, balance, cardiovascular output, and neurological timing.
When walking slows significantly, something in that integrated system is degrading.
Normal walking speed by age declines from roughly 1.3 m/s in healthy 40-year-olds to around 0.9–1.0 m/s in healthy 70-year-olds. Below 0.8 m/s, falls risk in elderly individuals rises dramatically, and the probability of sarcopenia or frailty becomes clinically significant.
Skeletal Muscle Index (SMI)
The Skeletal Muscle Index is the most direct measurement in this calculator. Where grip strength measures what your muscles can do, and gait speed measures how they perform, SMI measures what you actually have.
The formula:
textSMI = Appendicular Skeletal Muscle Mass (kg) ÷ Height² (m²)
Appendicular skeletal muscle mass, the muscle in your arms and legs, is measured most accurately through dual-energy X-ray absorptiometry (DXA). DXA gives you bone density, fat mass, and muscle mass in a single scan.
If DXA is not accessible, bioelectrical impedance analysis (BIA) is a reasonable alternative available at many gyms, sports clinics, and hospitals.
The EWGSOP2 cutoffs used in this calculator set low muscle mass at SMI below 7.0 kg/m² in men and below 5.5 kg/m² in women.
The AWGS 2019 guidelines use slightly adjusted thresholds for Asian populations. If you are using this tool in that clinical context, AWGS 2019 values for grip strength and SMI should be cross-referenced.
What Is Sarcopenia? (Definition and Clinical Criteria)
Sarcopenia is the progressive loss of skeletal muscle mass, muscle strength, and physical function that comes with aging. The term comes from the Greek words sarx, meaning flesh, and penia, meaning poverty.
It was first formally described as a clinical entity in the late 1980s by researcher Irwin Rosenberg and now carries its own official disease code: ICD-10 M62.84.
It is not the same as being out of shape. Sarcopenia is a recognized medical condition with measurable biological causes, defined diagnostic criteria, and evidence-based interventions.
The difference between general deconditioning and sarcopenia is that sarcopenia involves fundamental biological changes in how the body builds, maintains, and repairs muscle tissue, changes that go beyond what exercise alone causes.
What is actually happening in the body:
- Fast-twitch Type II muscle fibers decrease in both number and size; these are the fibers responsible for power, speed, and functional strength
- Motor neurons that control those fibers degenerate with age
- Anabolic hormones, including testosterone and insulin-like growth factor 1 (IGF-1), decline, reducing the body’s capacity to synthesize muscle protein
- Chronic low-grade inflammation increases levels of catabolic cytokines like TNF-alpha and interleukin-6, which actively break down muscle tissue
- Physical inactivity, muscle loss, compound all of the above
The practical consequences of untreated sarcopenia are serious. Falls risk in elderly adults increases. Physical disability becomes more likely. The quality of life in older adults drops. Hospital stays become longer, and recovery becomes slower.
The connection between sarcopenia and type 2 diabetes, metabolic syndrome, muscle loss, osteoporosis, sarcopenia overlap, heart failure, and COPD muscle wasting is well documented.
Sarcopenia is not the only condition that causes muscle loss. These related but distinct conditions are worth understanding:
| Condition | Primary Driver | Rate of Loss | Key Difference |
|---|---|---|---|
| Sarcopenia | Aging + inactivity | Slow, gradual | Age-related biology |
| Cachexia | Active disease (cancer, sepsis) | Rapid | Driven by inflammation |
| Myopenia | Broad term for low muscle mass | Variable | Non-specific cause |
| Dynapenia | Strength loss without mass loss | Variable | Function, not size |
| Malnutrition | Inadequate intake | Variable | Nutritional deprivation |
This calculator screens specifically for sarcopenia risk. Distinguishing between these conditions in a clinical setting requires evaluation by a healthcare professional.
EWGSOP2 and AWGS 2019 Diagnostic Guidelines
Two major international bodies have produced the most widely used diagnostic frameworks for sarcopenia. Knowing what they recommend helps you understand why this calculator is scored the way it is, and what the numbers actually mean in a clinical context.
EWGSOP2: The 2018 European Consensus
The European Working Group on Sarcopenia in Older People published its original consensus in 2010 and released a major update in 2018, known as EWGSOP2. This update made one critical change that shifted how clinicians think about sarcopenia diagnosis.
EWGSOP2 moved low muscle strength, not low muscle mass, to the primary diagnostic criterion.
That shift matters. It means the first clinical red flag is now functional, how your muscles perform, rather than structural, how much muscle you have. Low grip strength, detected by a handgrip dynamometer, is now the recommended first-line measurement.
EWGSOP2 stages sarcopenia in three levels:
| Stage | Criteria |
|---|---|
| Probable Sarcopenia | Low muscle strength only |
| Confirmed Sarcopenia | Low muscle strength + low muscle mass or quality |
| Severe Sarcopenia | Both of the above + low physical performance (gait speed, SPPB, or Timed Up and Go test) |
The EWGSOP2 also recommends the SARC-F questionnaire as a pre-screening tool. It is five simple self-report questions covering strength, walking, rising from a chair, stair climbing, and fall history.
A SARC-F score of 4 or higher suggests a high probability of sarcopenia. The enhanced SARC-CalF screening tool adds a calf circumference measurement, below 34 cm in men and 33 cm in women, for improved sensitivity in community screening settings.
AWGS 2019: The Asian Consensus
The Asian Working Group for Sarcopenia released its updated guidelines in 2019. Asian adults tend to have different baseline body composition values compared to European populations, so the AWGS 2019 uses slightly different cutoff thresholds.
Key AWGS 2019 measurement cutoffs:
| Measurement | Male Cutoff | Female Cutoff |
|---|---|---|
| Grip Strength | Below 28 kg | Below 18 kg |
| Gait Speed | Below 1.0 m/s | Below 1.0 m/s |
| SMI via DXA | Below 7.0 kg/m² | Below 5.4 kg/m² |
| SMI via BIA | Below 7.0 kg/m² | Below 5.7 kg/m² |
The AWGS 2019 also introduced a fast-screening pathway using calf circumference measurement and the SARC-CalF tool for community and primary care settings where DXA and detailed testing are not readily available.
How these guidelines shape this calculator: The scoring thresholds used here align primarily with EWGSOP2. If you are using this tool in a clinical context with Asian patients, cross-reference AWGS 2019 values, particularly for grip strength, where the female cutoff differs meaningfully.
Who Should Use This Calculator?
This tool is designed for adults and caregivers who want to understand muscle loss risk. It also works as a supplementary reference for clinicians running a geriatric assessment in primary care or outpatient settings.
Use this calculator if you are:
- 65 or older — the primary population for sarcopenia screening based on every major guideline
- Experiencing unexplained muscle weakness, struggling with tasks that used to feel easy: opening jars, rising from a chair, climbing stairs
- Walking more slowly than before, a subtle sign that is easy to dismiss, and important not to
- Managing a chronic illness, COPD, muscle wasting, heart failure, muscle loss, and cancer cachexia all accelerate sarcopenia progression significantly
- Recovering from surgery or serious illness, pre-operative assessment in elderly patients benefits from knowing baseline muscle status, and post-illness recovery is directly affected by muscle reserves
- A caregiver monitoring a loved one, tracking functional decline in older adults over time, gives you data to bring to medical appointments
- A clinician, quick functional screening before referring for full geriatric assessment or DXA
Conditions that meaningfully increase sarcopenia risk:
- Type 2 diabetes sarcopenia, insulin resistance impairs muscle protein synthesis
- Metabolic syndrome, muscle loss, and chronic systemic inflammation degrade muscle tissue
- Osteosarcopenia, the overlap of osteoporosis and sarcopenia, where bone and muscle loss occur together
- Vitamin D deficiency causes muscle loss, as low vitamin D directly impairs muscle fiber function and contraction
- Chronic kidney disease
- Long-term corticosteroid use
- Rheumatoid arthritis
- Physical inactivity muscle loss from prolonged bed rest or a sedentary lifestyle
This calculator is less suitable for:
- People with acute medical conditions requiring immediate care
- Individuals with severe cognitive impairment who cannot self-report accurately
- Patients with acute hand injuries or conditions affecting grip strength testing
- People in critical care or ICU settings
Sarcopenia vs Frailty vs Cachexia
These three terms appear together constantly in clinical literature — and get used interchangeably in conversation. They should not be. Each describes a different process with different causes, different progression rates, and different management approaches.
| Feature | Sarcopenia | Frailty | Cachexia |
|---|---|---|---|
| Primary cause | Aging + inactivity | Multi-system decline | Active disease |
| Muscle loss | Yes — central feature | Yes — often present | Yes — rapid and severe |
| Weight loss | Variable | Often present | Prominent and fast |
| Inflammation level | Low-grade | Variable | High and sustained |
| Reversible? | Partially | Partially | Very difficult |
| ICD-10 code | M62.84 | R54 | R64 |
| Key diagnostic tool | SMI + grip strength | Fried frailty criteria | Disease biomarkers |
| Primary intervention | Resistance training + protein | Multicomponent program | Treat underlying disease |
Frailty: What Makes It Different
Frailty is a broader clinical syndrome. The Fried frailty criteria, developed by researcher Linda Fried, define frailty using five components: unintentional weight loss, self-reported exhaustion, measured weakness (grip strength), slow walking speed, and low physical activity level.
Meeting three or more confirms frailty. Meeting one or two indicates pre-frailty.
The clinical frailty scale, a 9-point scale ranging from “very fit” to “terminally ill,” is a faster bedside tool used widely in hospital settings.
Sarcopenia and frailty overlap significantly. Most frail people have sarcopenia. But not everyone with sarcopenia is frail; frailty also requires exhaustion and very low activity levels beyond muscle loss alone.
Cachexia: The Disease-Driven Version
Cachexia is driven by active systemic disease — most commonly cancer cachexia, muscle wasting, heart failure, muscle loss, COPD, or chronic kidney disease. Unlike sarcopenia, cachexia involves a powerful inflammatory response that breaks down both muscle and fat simultaneously and rapidly.
Cachexia is not primarily an aging problem. And it is dramatically harder to reverse because the disease driving it keeps breaking tissue down faster than any intervention can rebuild it.
The clearest practical distinction: sarcopenia vs cachexia comes down to speed and driver. Sarcopenia is slow and age-driven. Cachexia is fast and disease-driven. Both reduce muscle mass — but they require different clinical responses.
Treatment and Interventions by Risk Level
Sarcopenia responds to treatment, especially when caught early. The evidence is consistent across hundreds of studies. Three pillars drive the best outcomes: exercise, nutrition, and medical management. They work best together.
Exercise Interventions
Progressive resistance training is the single most effective intervention for sarcopenia. The word “progressive” is critical; the load must increase over time to keep challenging the muscle. Without progression, adaptation stops.
Evidence-based exercise prescription for elderly adults with sarcopenia risk:
| Variable | Recommendation |
|---|---|
| Frequency | 2–3 sessions per week |
| Intensity | 70–85% of 1-rep maximum (with clinical guidance) |
| Exercise type | Compound movements: squats, deadlifts, rows, step-ups, chest press |
| Session duration | 45–60 minutes |
| Minimum program length | 8–12 weeks to see measurable strength gains |
For those who are severely deconditioned or high-risk, starting with bodyweight exercises or light resistance bands under physical therapy supervision for sarcopenia is the right approach. Progress from there.
Balance training and aerobic exercise complement resistance work. The 6-minute walk test is often used to track cardiovascular improvement alongside muscle function. Aerobic exercise alone does not meaningfully increase muscle mass in sarcopenic individuals; it must be paired with resistance work.
Common exercise mistakes to avoid:
| Mistake | Better Approach |
|---|---|
| Only walking for exercise | Add resistance training 2–3 times per week |
| Using weights that feel comfortable | Build a foundation first, especially for high-risk individuals |
| Exercising when convenient | Maintain a fixed, consistent weekly schedule |
| Skipping recovery | Prioritize sleep and post-workout protein |
| Starting at maximum intensity | Build a foundation first, especially for high-risk individuals |
| Stopping when things improve | Sarcopenia requires lifetime maintenance |
Nutritional Interventions
Muscle is built from protein. Without adequate protein intake, exercise alone cannot rebuild what aging and disease take away. This is one of the most consistent findings in sarcopenia research.
Key nutritional targets for adults with sarcopenia risk:
- Total daily protein: 1.2–1.6 g per kg of body weight, significantly above the standard RDA of 0.8 g/kg, which was not designed with muscle preservation in aging adults in mind
- Leucine protein synthesis: Each meal should contain at least 2.5–3 g of leucine, the essential amino acid that most powerfully activates muscle protein synthesis. This is why leucine content matters, not just total protein
- Essential amino acids: Spreading protein across 3–4 meals is more effective than eating most of it in one sitting. Older muscles are less responsive to individual protein doses
- Vitamin D: Target serum 25-hydroxyvitamin D levels of 30 ng/mL or above. Vitamin D deficiency muscle loss is well established; supplementation improves muscle fiber function in deficient individuals
Best protein sources for muscle preservation:
| Source | Protein per 100g | Leucine Content | Notes |
|---|---|---|---|
| Whey protein powder | ~80g | Very high | Fast-absorbing; ideal post-exercise. Whey protein sarcopenia research is extensive and consistently positive |
| Eggs | ~13g | High | Complete amino acid profile; affordable and versatile |
| Chicken breast | ~31g | High | Lean, widely available |
| Greek yogurt | ~10g | Moderate-High | Easy to consume for older adults with appetite issues |
| Salmon | ~25g | High | Also provides omega-3 fatty acids |
| Lentils | ~9g | Moderate | Plant-based option; pair with other protein sources |
Omega-3 muscle preservation is supported by growing evidence. Fish oil supplementation providing 2–3 g of EPA and DHA daily appears to enhance the muscle’s sensitivity to both protein and exercise stimuli, making your other interventions work better rather than doing the work independently.
Creatine supplementation in the elderly research is consistently positive across multiple well-designed trials. Creatine monohydrate at 3–5 g per day, combined with resistance training, increases both strength and lean mass in older adults more effectively than training alone.
For high-risk individuals, a formal MNA (Mini Nutritional Assessment), a validated malnutrition elderly screening tool, helps quantify nutritional deficits systematically and guides dietitian-led intervention more precisely than an informal assessment.
Medical Management
Nutrition and exercise are the foundation, but some people need additional medical investigation and support alongside those lifestyle changes.
Important things to investigate medically:
- Albumin levels and sarcopenia: Low serum albumin below 3.5 g/dL indicates poor nutritional status and correlates strongly with muscle loss severity and poor recovery outcomes
- Creatinine height index: A urine-based biochemical test that estimates skeletal muscle mass, clinically useful when DXA or BIA is not accessible
- Testosterone and muscle mass: Low testosterone in men is treatable and directly impacts muscle anabolism. Testosterone replacement in confirmed hypogonadism can improve muscle mass, but it is not a general sarcopenia treatment
- Vitamin D status: Should be standard in any sarcopenia workup; deficiency is common in older adults and directly treatable
- Medication review: Several commonly prescribed medications can accelerate muscle loss, including long-term corticosteroids, statins at high doses, and some antihypertensives, which warrant review in the context of sarcopenia management
Diagnostic tools for muscle mass assessment:
Dual-energy X-ray absorptiometry (DXA) remains the gold standard for body composition analysis. A single DXA scan gives precise appendicular skeletal muscle mass, bone mineral density, and fat mass data simultaneously.
It is the reference standard that EWGSOP2 and AWGS 2019 both use to define diagnostic thresholds.
Bioelectrical impedance analysis (BIA) is faster, cheaper, and widely available. It passes a small electrical current through the body and estimates tissue composition based on resistance.
It is less precise than DXA in absolute terms, but it is accurate enough for monitoring trends over time, which is how most clinical follow-up works.
For the highest-risk individuals, multidisciplinary geriatric care consistently outperforms any single intervention. A geriatrician coordinates care.
A dietitian manages protein and micronutrient optimization. A physical therapist delivers and progresses the resistance training program. This team-based approach is the standard of care in comprehensive geriatric assessment programs globally.
Frequently Asked Questions
It is a free, point-based tool that estimates your risk of sarcopenia, age-related muscle loss, using five inputs: age, BMI, grip strength, walking speed, and skeletal muscle index. Scores range from 0 to 10. Higher scores indicate higher risk and the need for earlier intervention.
This calculator estimates risk; it does not diagnose sarcopenia. A score of 7 or above indicates high risk and warrants clinical evaluation. A formal diagnosis requires professional assessment using validated tools, including grip strength testing, gait speed measurement, and muscle mass quantification via DXA or BIA.
It is a validated risk screening tool, not a diagnostic instrument. Accuracy depends on correct measurements, particularly grip strength and walking speed. It is most useful for identifying who needs further assessment, not for replacing that assessment.
The calculator applies most accurately to adults 65 and older. However, younger adults with conditions that cause muscle wasting, including COPD, cancer, type 2 diabetes, or prolonged physical inactivity, may also benefit from using it.
Low-risk individuals should reassess annually. Moderate-risk individuals should recheck every 3–6 months, especially after starting an intervention. High-risk individuals should follow a monitoring schedule set by their clinical team.
SARC-F is a 5-question self-report screening tool covering strength, walking, rising from a chair, climbing stairs, and falls. A score of 4 or higher suggests probable sarcopenia. It complements this calculator; SARC-F is faster; this tool uses objective measurements for more precision.
Partial reversal is realistic with consistent effort. Progressive resistance training and adequate protein intake can meaningfully increase muscle strength and mass in older adults at any age. Full restoration to peak muscle mass is unlikely, but significant functional improvement is achievable.
Sarcopenia is specifically muscle-focused, loss of mass, strength, and function. Frailty is broader — it includes exhaustion, very low activity, and weight loss alongside weakness. Most frail people have sarcopenia, but sarcopenia can exist without full frailty. They overlap but are not the same condition
Related Calculators
These tools pair naturally with the Sarcopenia Risk Calculator to give you a fuller picture of physical health and aging:
- Frailty Index Calculator
- BMI Calculator
- Ideal Body Weight Calculator
- Calorie and Protein Needs Calculator
- Body Fat Percentage Calculator
- Skeletal Muscle Mass Calculator
- Grip Strength Calculator
- Biological Age Calculator