The Biological Age Calculator estimates your phenotypic age using 9 blood test biomarkers, giving you a far more accurate picture of how fast your body is aging than your birthday ever could.
Unlike chronological age, biological age reflects what is actually happening inside your cells. Enter your
blood test results below and find out your true phenotypic age in seconds, completely free.
Phenotypic Age Calculator
Estimate your biological age using the Levine Model based on 9 clinical biomarkers.
Enter your lab values above to see your biological age results.
Your biological age is an estimate of your body’s functional status compared to your chronological age.
Key Takeaways
- Your biological age can be years younger or older than your calendar age, and blood tests reveal which
- This calculator uses the Levine Phenotypic Age formula, developed at Yale University and published in 2018
- It needs 9 common blood test values that most standard panels already include
- A biological age lower than your chronological age means your body is aging more slowly than average
- Lifestyle changes, diet, exercise, sleep, and stress management can meaningfully lower your biological age
This tool is completely free, no email, no signup, no hidden fees
What Is the Biological Age Calculator?
The Biological Age Calculator is a free tool that estimates how old your body actually is on the inside, not just how many years you have been alive.
It uses your blood test results to calculate your phenotypic age, a scientifically validated score that reflects how well your body is functioning right now. The result can be younger than your real age, older, or the same. All three outcomes tell you something important.
What This Tool Measures
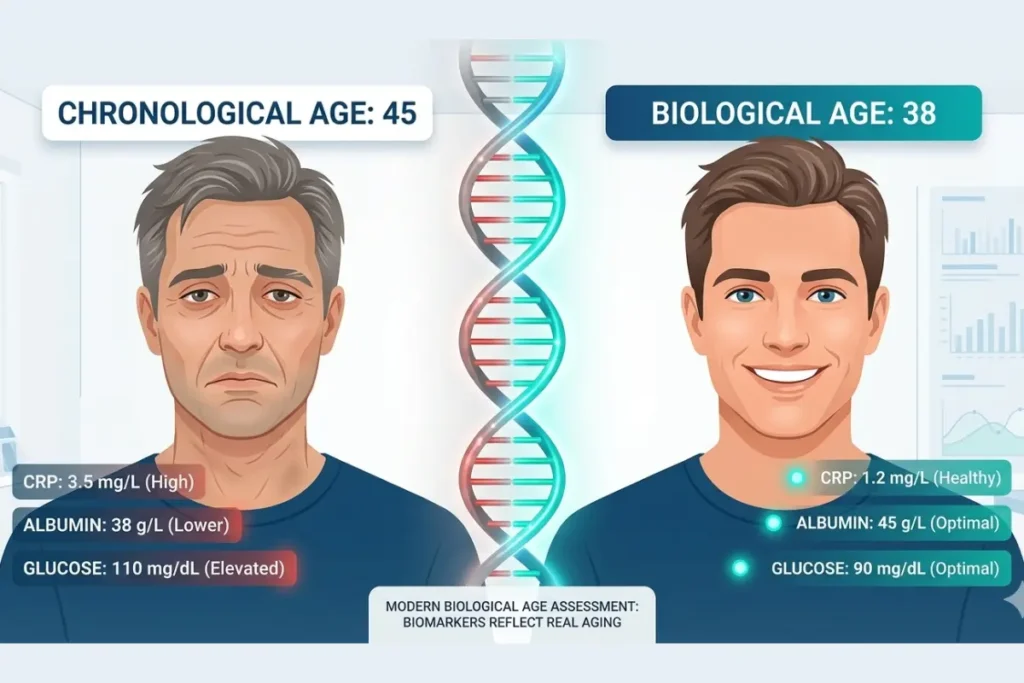
This tool measures your biological age, also called phenotypic age. That is different from your chronological age, which is simply the number of years since you were born.
Two people can be exactly 45 years old. But one might have the body of a 38-year-old. The other might have the body of a 54-year-old. Same calendar age. Very different biological reality. This calculator shows you which side of that equation you are on.
It does this by analyzing 9 blood biomarkers — measurable substances in your blood that research links directly to how fast your body is aging. Together, these markers paint a picture of your immune system health, inflammation levels, organ function, and cellular health — all at once.
How It Differs From Other Age Calculators
Most biological age calculators use weight, height, BMI, or simple lifestyle questions. Those tools give rough estimates. This one is different.
This calculator uses the Levine Phenotypic Age formula — a mathematically validated equation developed by researcher Dr. Morgan Levine at Yale University. It is based on actual blood chemistry, not self-reported lifestyle habits. That makes it significantly more accurate than weight-based or questionnaire-based tools.
| Calculator Type | Inputs Used | Accuracy Level |
|---|---|---|
| This calculator (Phenotypic Age) | 9 blood biomarkers | High — research validated |
| Weight/BMI-based calculator | Height, weight, age | Low — no internal data |
| Lifestyle questionnaire | Sleep, diet, exercise | Moderate — self-reported |
| AI biological age calculator | Photos or surveys | Variable — not validated |
| Epigenetic clock (lab test) | DNA methylation | Very high — most expensive |
Why Blood Test Results Are Used
Blood is the best window into your body’s internal state. It carries information about your organs, immune system, inflammation levels, and cellular health, all at the same time.
The 9 biomarkers in this calculator were specifically chosen because research showed they collectively predict mortality risk and aging acceleration better than any single marker alone. They are all part of standard blood panels, so you likely already have these results if you have had a recent health checkup.
Who Should Use This Calculator
This tool is useful for anyone who wants to understand their true health age. However, it is especially valuable for:
- Adults over 30 who want a baseline aging measurement
- People with existing health conditions are monitoring their aging trajectory
- Anyone focused on longevity and healthspan
- Fitness enthusiasts tracking the impact of their lifestyle
- People who have recently changed their diet, exercise, or sleep habits
- Anyone curious about whether their body is aging faster or slower than average
How to Use the Biological Age Calculator (Step-by-Step)
Using this tool takes about two minutes. However, you need your blood test results first. Here is exactly what to do.
Step 1: Enter Your Date of Birth
Type your date of birth in MM/DD/YYYY format. The calculator uses this to determine your chronological age — the baseline it compares your biological age against. Without this, it cannot tell you whether your body is aging faster or slower than expected.
Step 2: Enter Your Date of Blood Test
Enter the date your blood test was taken. This matters because blood values change over time. Using the date of the test ensures your result reflects where your body was at that specific point in time — not now, if your test was from months ago.
Step 3: Enter Your 9 Blood Test Values
Find each of these values on your blood test report and enter them carefully:
| Biomarker | Unit | Typical Range | Where to Find It |
|---|---|---|---|
| Albumin | g/dL | 3.5 – 5.0 | Comprehensive Metabolic Panel |
| Creatinine | mg/dL | 0.6 – 1.2 | Comprehensive Metabolic Panel |
| Glucose | mg/dL | 70 – 99 | Comprehensive Metabolic Panel |
| C-Reactive Protein (CRP) | mg/L | Below 3.0 | Inflammation panel |
| Lymphocyte % | % | 20 – 40 | Complete Blood Count (CBC) |
| Mean Cell Volume (MCV) | fL | 80 – 100 | Complete Blood Count (CBC) |
| Red Cell Distribution Width (RDW) | % | 11.5 – 14.5 | Complete Blood Count (CBC) |
| Alkaline Phosphatase | U/L | 44 – 147 | Comprehensive Metabolic Panel |
| White Blood Cells | cells/mL | 4,500 – 11,000 | Complete Blood Count (CBC) |
Enter each value exactly as shown on your report. Do not round numbers. Small differences in values affect the calculation.
Step 4: Read and Interpret Your Result
After entering all values, the calculator instantly shows your phenotypic age. Compare it to your chronological age:
- Lower number = good — your body is biologically younger than your calendar age
- Same number = average — your body is aging at the expected rate
- Higher number = attention needed — your body is aging faster than expected
How to Get Your Blood Test Results
You need actual lab results to use this tool. Here is how to get them:
- Ask your doctor for a Complete Blood Count (CBC) and Comprehensive Metabolic Panel at your next checkup — these two tests cover all 9 biomarkers
- Order a private blood test through a direct-to-consumer lab service
- Use an at-home blood test kit — several services now allow finger-prick testing at home with lab-quality results
- Check your online patient portal — if you have had blood tests recently, your results are likely already available online
How to Read Your Blood Test Report
Blood test reports look complicated. However, they follow a simple structure:
- Each row is one biomarker
- The number in the middle is your result
- The range shown is the normal reference range
- An “H” next to a value means high — an “L” means low
- Results without letters are within normal range
Find each of the 9 biomarkers by name. Enter the number in the result column — not the reference range.
The 9 Blood Biomarkers Explained
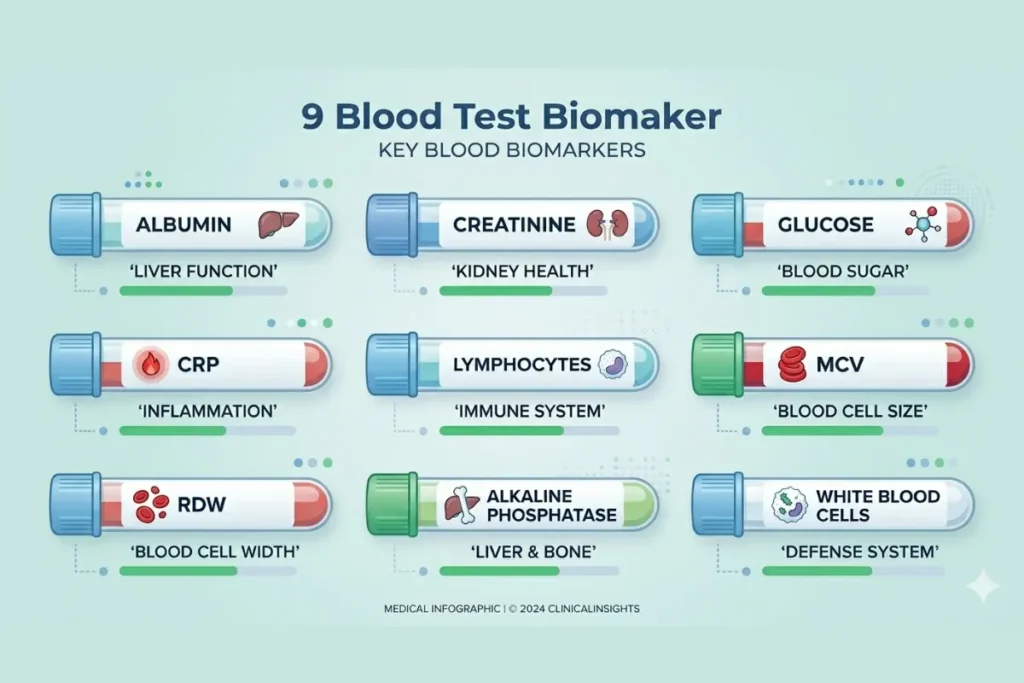
Each of the 9 biomarkers in this calculator tells a different part of your aging story. Here is what each one means, and what your number says about your health.
Albumin: What It Measures and Normal Range
What it is: Albumin is the most common protein in your blood. Your liver makes it. It carries nutrients, hormones, and medications around your body.
What it tells us about aging: Albumin levels fall as people age. Low albumin signals poor nutrition, liver stress, or chronic inflammation. Higher albumin generally means better health and slower biological aging.
Normal range: 3.5 – 5.0 g/dL
What low albumin looks like: Levels below 3.5 g/dL suggest your body may be under significant stress. This is associated with faster biological aging in the Levine formula.
Creatinine: What It Measures and Normal Range
What it is: Creatinine is a waste product made when your muscles break down. Your kidneys filter it out of your blood. Creatinine levels show how well your kidneys are working.
What it tells us about aging: Kidney function declines with age. However, very low creatinine can also signal low muscle mass, another aging concern. The formula accounts for both directions.
Normal range: 0.6 – 1.2 mg/dL (men slightly higher than women)
Glucose: What It Measures and Normal Range
What it is: Glucose is blood sugar — the main fuel your body runs on. This test measures your fasting blood sugar level.
What it tells us about aging: High fasting glucose accelerates biological aging through a process called glycation, where excess sugar damages proteins and DNA. Consistently elevated glucose is one of the strongest drivers of age acceleration.
Normal fasting range: 70 – 99 mg/dL
Important: This should be a fasting measurement — taken after at least 8 hours without food.
C-Reactive Protein (CRP): Inflammation Marker
What it is: CRP is a protein your liver releases when your body is inflamed. High CRP means your immune system is working overtime — even if you feel fine.
What it tells us about aging: Chronic low-grade inflammation, sometimes called inflammaging, is one of the main drivers of biological aging. Elevated CRP is one of the strongest single predictors of accelerated aging in this formula.
Normal range: Below 3.0 mg/L (below 1.0 mg/L is optimal for aging purposes)
High CRP causes: Obesity, poor diet, smoking, alcohol, chronic stress, infections, and autoimmune conditions all raise CRP.
Lymphocyte Percentage: Immune System Marker
What it is: Lymphocytes are a type of white blood cell. They are your immune system’s specialized fighters — attacking viruses, bacteria, and cancer cells.
What it tells us about aging: Lymphocyte percentage drops as people age — a process called immunosenescence, where the immune system gradually becomes less effective. Low lymphocyte percentage is associated with faster biological aging.
Normal range: 20 – 40% of total white blood cells
Mean Cell Volume (MCV): Red Blood Cell Size
What it is: MCV measures the average size of your red blood cells. These are the cells that carry oxygen around your body.
What it tells us about aging: Abnormal MCV — either too high or too low, signals problems with red blood cell production. High MCV is linked to vitamin B12 deficiency, folate deficiency, and liver disease. It rises with age and is associated with increased biological aging.
Normal range: 80 – 100 fL
Red Cell Distribution Width (RDW): Cell Variation
What it is: RDW measures how much variation exists in the size of your red blood cells. Ideally, your red blood cells should all be roughly the same size.
What it tells us about aging: High RDW means your red blood cells are very different sizes — a sign of nutritional deficiency or underlying health stress. RDW is one of the most powerful predictors of biological aging in the Levine formula. Higher RDW consistently links to faster aging and higher mortality risk.
Normal range: 11.5 – 14.5%
Alkaline Phosphatase: Liver and Bone Marker
What it is: Alkaline phosphatase is an enzyme found mainly in your liver and bones. Elevated levels suggest liver stress or high bone turnover.
What it tells us about aging: Rising alkaline phosphatase with age reflects declining liver efficiency and increased bone remodeling. Both are markers of biological aging. The Levine formula uses this as an indicator of internal organ function.
Normal range: 44 – 147 U/L
White Blood Cell Count: Immune Activity
What it is: White blood cells (WBCs) are your immune system’s army. Your WBC count shows how many of these cells are circulating in your blood right now.
What it tells us about aging: Both very high and very low WBC counts signal problems. High WBC suggests active inflammation or infection. Very low WBC suggests immune suppression. The optimal range for biological aging sits in the middle of the normal range.
Normal range: 4,500 – 11,000 cells/mL
Understanding Your Biological Age Result
Your result is a single number, your estimated phenotypic age. Here is how to make sense of it.
What Does Your Phenotypic Age Score Mean?
Your phenotypic age score reflects the biological state of your body based on these 9 blood markers. It is not your exact biological age to the month. It is a statistically validated estimate of how old your body functions compared to population averages.
Think of it this way. If 1,000 people all had your exact blood values, their average chronological age would be close to your phenotypic age score. Your body is functioning like someone of that age, regardless of what your birth certificate says.
Biological Age Younger Than Chronological Age
This is the ideal result. If your biological age is lower than your chronological age, your body is aging more slowly than expected. For example, if you are 50 years old but your phenotypic age comes back as 43, your body is functioning like a typical 43-year-old.
This usually means your biomarkers are in healthy ranges, low inflammation, good organ function, strong immune activity, and healthy blood cell production.
Before and after example:
A 52-year-old woman changes her diet and starts exercising regularly. Her first test shows biological age of 57 — five years older than her real age. After 12 months of consistent lifestyle changes, her second test shows biological age of 49 — three years younger than her real age. A 8-year improvement in one year.
Biological Age Older Than Chronological Age
If your biological age is higher than your chronological age, your body is aging faster than expected. This is a signal — not a verdict. It means one or more of your biomarkers are outside their optimal ranges.
The good news is that most of the factors driving accelerated biological aging are modifiable. Diet, exercise, sleep, stress, and smoking all affect these biomarkers, and all are within your control.
What Is a Good Biological Age Score?
The goal is simple: a biological age lower than chronological age. However, context matters.
| Result | What It Means | Action |
|---|---|---|
| 5+ years younger | Excellent — body aging slowly | Maintain current habits |
| 1–4 years younger | Good — slightly ahead of schedule | Small optimizations |
| Same as chronological | Average — aging at expected rate | Room for improvement |
| 1–4 years older | Below average — mild acceleration | Lifestyle review needed |
| 5+ years older | Concerning — significant acceleration | Medical consultation recommended |
How Much Can Biological Age Differ From Chronological Age?
Research shows biological age can differ from chronological age by 10 to 20 years in either direction. Elite athletes and people with exceptional lifestyle habits sometimes score 10–15 years younger than their chronological age. People with chronic disease, poor diet, or heavy smoking sometimes score 10–20 years older.
The average difference in the general population is around 3 to 5 years in either direction.
What Is Biological Age? (Full Explanation)
Biological age is a measure of how old your body actually functions — based on what is happening inside your cells, organs, and blood — rather than how many years you have been alive.
It is one of the most important concepts in modern aging research. And it is finally accessible to everyday people through tools like this calculator.
Biological Age vs Chronological Age
Chronological age is simple. It is the number of years since your birthday. It moves forward at exactly one year per year for everyone on earth. No lifestyle change, no medication, and no supplement changes it.
Biological age is different. It moves at different speeds for different people, depending on genetics, lifestyle, environment, and health status. Two people born on the same day can have biological ages that differ by 20 years or more.
This is why some 70-year-olds run marathons while others struggle to climb stairs. Chronological age is the same. Biological age is completely different.
The 4 Types of Age: Chronological, Biological, Functional, and Psychological
Most people only know about one type of age. However, researchers recognize four distinct types:
| Type of Age | Definition | How It Is Measured |
|---|---|---|
| Chronological age | Years since birth | Birth certificate |
| Biological age | How old is your body function internally | Blood tests, epigenetic clocks |
| Functional age | Physical and cognitive ability level | How old your body function internally |
| Psychological age | Grip strength, walking speed, and cognitive tests | Self-report, mental health assessments |
All four types of age matter for overall health. However, biological age is the most measurable and most directly linked to mortality risk and healthspan.
What Causes Biological Age to Accelerate?
Several factors push biological age higher faster than it should go:
- Chronic inflammation the biggest single driver of age acceleration
- A poor diet, high sugar, and processed food damage cells
- Physical inactivity causes muscles and organs to degrade without use
- Poor sleep, cellular repair happens during sleep
- Chronic stress elevates cortisol, which accelerates cell aging
- Smoking directly damages DNA and raises CRP dramatically
- Excessive alcohol stresses the liver and raises inflammation
- Obesity increases systemic inflammation and metabolic stress
- Untreated chronic disease: Diabetes, hypertension, and heart disease all accelerate aging
Can You Be Biologically Younger Than Your Calendar Age?
Yes, absolutely. And many people are. Research consistently shows that people with healthy lifestyles, low inflammation, good sleep, regular exercise, and nutritious diets score years younger on phenotypic age tests.
Furthermore, biological age can improve over time. Studies show that lifestyle interventions, particularly diet changes and exercise, can meaningfully reduce biological age within months, not years.
The Science Behind Phenotypic Age
This calculator is not guesswork. It is built on peer-reviewed research from one of the world’s leading aging scientists.
Who Created the Phenotypic Age Formula?
The phenotypic age formula was created by Dr. Morgan Levine, a researcher in the Department of Pathology at Yale University School of Medicine. Dr. Levine is one of the most respected scientists working in the field of aging biology and epigenetics.
She developed phenotypic age as a way to quantify biological aging using standard clinical blood tests — making it accessible to anyone, anywhere, without needing expensive genetic testing.
Morgan Levine and Yale University Research
Dr. Levine’s work sits at the intersection of epigenetics, aging biology, and data science. Her research asks a fundamental question: why do some people age faster than others, and can we measure and change that rate?
Her 2018 study, published in the journal Aging (Albany, NY), introduced the phenotypic age concept to the scientific community. It has since been cited hundreds of times by other researchers worldwide and validated in multiple independent studies.
The Original 2018 Study: What It Found
The full title of the study is: “An epigenetic biomarker of aging for lifespan and healthspan”, published in the Aging journal, volume 10, issue 4, pages 573–591, April 2018.
Key findings from the study:
- Phenotypic age predicted mortality risk more accurately than chronological age alone
- People with lower phenotypic age had significantly better health outcomes across all age groups
- The 9 blood biomarkers together explained a large proportion of the variation in aging between individuals
- Phenotypic age correlated strongly with epigenetic clock measurements — the most precise aging measures available
How the Phenotypic Age Formula Works
The formula uses your 9 blood values and age to calculate a mortality score — and then converts that into an estimated phenotypic age.
The core formula has two steps:
Step 1 — Calculate the mortality score (xb):
textxb = −19.9067
+ (−0.0336 × albumin)
+ (0.0095 × creatinine)
+ (0.1953 × glucose)
+ (0.0954 × ln(CRP))
+ (−0.0120 × lymphocyte%)
+ (0.0268 × MCV)
+ (0.3306 × RDW)
+ (0.00188 × alkaline phosphatase)
+ (0.0554 × WBC)
+ (0.0804 × chronological age)
Step 2 — Convert to phenotypic age:
textMortality Score = 1 − e^(−e^xb × (e^(0.0076927 × chronological age) − 1) / 0.0076927)

Phenotypic Age = 141.50 + (ln(−0.00553 × ln(1 − Mortality Score)) / 0.090165)
This looks complex. However, the calculator handles all of this automatically. You just enter your values and read the result.
Epigenetic Clocks vs Phenotypic Age
Epigenetic clocks are another way to measure biological age. They analyze DNA methylation — chemical changes on your DNA that accumulate with aging. They are considered the most precise aging measurement available.
However, they require specialized lab testing that costs hundreds to thousands of dollars. Phenotypic age achieves similar predictive power using standard, affordable blood tests.
| Measurement | Accuracy | Cost | Accessibility |
|---|---|---|---|
| Phenotypic Age (this tool) | High | Free (if you have blood test) | Very high |
| Horvath Clock | Very high | $300–$500+ | Low — specialist labs |
| GrimAge Clock | Very high | $300–$500+ | Low — specialist labs |
| DunedinPACE | Very high | $300–$500+ | Low — specialist labs |
| Lifestyle questionnaire | Low | Free | Very high |
Horvath Clock, GrimAge, and DunedinPACE Explained
The Horvath Clock was developed by Dr. Steve Horvath at UCLA. It was the first widely validated epigenetic clock. It uses DNA methylation patterns across hundreds of sites in the genome to estimate biological age.
GrimAge is a more advanced version that predicts time-to-death more accurately than the original Horvath Clock. It incorporates plasma protein levels alongside DNA methylation.
DunedinPACE measures the pace of aging rather than current biological age. It tells you how fast your biological age is currently increasing — like a speedometer for aging.
All three are research-grade tools. Phenotypic age using blood tests is the best practical alternative for everyday use.
DNA Methylation and Biological Aging
DNA methylation is a process where small chemical tags attach to your DNA. These tags change how genes are expressed, turning them on or off. As you age, methylation patterns shift in predictable ways. Scientists can read these patterns and estimate biological age with remarkable precision.
The connection to phenotypic age: the blood biomarkers in this calculator reflect many of the same biological processes that drive DNA methylation changes. That is why phenotypic age correlates so strongly with epigenetic clock measurements.
How Accurate Is the Phenotypic Age Calculator?
In the original Levine study, phenotypic age predicted mortality, disease risk, and disability significantly better than chronological age alone. Independent validation studies in different populations have confirmed these findings.
For practical purposes, accuracy is high enough to be clinically meaningful. However, a single test is a snapshot, not a permanent verdict. Results vary with illness, recent diet changes, medication, and hydration. Tracking your phenotypic age over multiple tests over time gives the most useful picture.
Biological Age vs Chronological Age: Key Differences
Understanding the gap between these two numbers is the whole point of this calculator. Here is why that gap matters so much.
Why Two People the Same Age Can Have Different Biological Ages
Genetics plays a role, but only about 25% of the variation in biological aging is genetic. The other 75% comes from lifestyle, environment, and health behaviors. This means most of your biological age is within your control.
Two people aged 45 can have biological ages of 38 and 58, respectively. The difference comes down to:
- How much inflammation do they carry in their body
- How well their organs function
- The quality of their immune system
- Their blood sugar regulation
- Their cellular health markers
What Biological Age Tells You That BMI Cannot
BMI tells you your weight relative to your height. That is useful, but it tells you nothing about what is happening inside your cells and organs. Someone can have a perfectly normal BMI and still have accelerated biological aging driven by chronic inflammation, poor blood sugar control, or declining organ function.
Biological age looks inside. BMI only looks at the outside.
Biological Age and Mortality Risk
Higher phenotypic age consistently predicts higher mortality risk in research. The original Levine study showed that each year of biological age above chronological age was associated with meaningfully higher rates of death from all causes, including cardiovascular disease, cancer, and respiratory disease.
Conversely, people with biological ages below their chronological age had significantly lower mortality risk, even after adjusting for other health factors.
Biological Age and Healthspan vs Lifespan
Lifespan is how long you live. Healthspan is how many of those years you spend in good health, physically capable, mentally sharp, and functionally independent.
The goal of reducing biological age is not just to live longer. It is to extend your healthspan — the number of years you spend feeling well and functioning fully. Research shows that people with lower biological ages maintain their physical function, cognitive performance, and independence significantly longer than those with higher biological ages.
Famous Examples: What Is Ronaldo’s Biological Age?
Ronaldo Biological Age: What Tests Show
Cristiano Ronaldo is one of the most tested athletes in the world. His club teams and personal medical staff conduct regular biological assessments. Reports from his time at Juventus and based on publicly available physiological data suggest his biological age is estimated to be around 23–25 years old, despite his chronological age being in his late 30s.
His biomarkers consistently show extremely low body fat (around 7%), excellent cardiovascular efficiency, low inflammatory markers, and outstanding muscle recovery rates. These all drive phenotypic age downward significantly.
This is not magic. It is the result of exceptional lifestyle discipline, elite nutrition, obsessive sleep management, daily recovery protocols, and training habits most people cannot match.
Other Athletes With Remarkable Biological Ages
| Athlete | Chronological Age | Estimated Biological Age | Key Factor |
|---|---|---|---|
| Cristiano Ronaldo | Late 30s | ~23–25 | Sleep, diet, training |
| LeBron James | Late 30s | ~28–30 | Recovery, nutrition |
| Tom Brady | Early 40s at retirement | ~30 | TB12 method, diet |
| Novak Djokovic | Late 30s | ~27–29 | Gluten-free diet, mindfulness |
Estimates based on publicly reported physiological assessments and sports science data — not direct phenotypic age tests.
What Elite Athletes Do Differently
Elite athletes do not just train harder. They manage every input that affects biological aging:
- Sleep: Most elite athletes sleep 9–10 hours per night, not the average 6–7
- Nutrition: Extremely low processed food, high protein, anti-inflammatory foods
- Recovery: Cold therapy, massage, and structured rest between sessions
- Stress management: Sports psychology support and mindfulness practice
- Regular monitoring: Quarterly blood tests to catch biomarker changes early
The good news is that you do not need to be a professional athlete to apply these principles. Moderate versions of all of them produce meaningful biological age improvements.
What Affects Your Biological Age?
Your biological age is not fixed. Multiple lifestyle and health factors push it up or down continuously. Here are the most important ones.
Inflammation and Aging: The Inflammaging Link
Chronic low-grade inflammation, a condition researchers call inflammaging, is the single biggest driver of biological age acceleration. Unlike acute inflammation, which happens when you cut your finger, inflammaging is silent. You cannot feel it. But it is constantly damaging your cells, blood vessels, and organs.
High C-reactive protein (CRP) in your blood test is the clearest sign of inflammaging. Elevated CRP directly raises your phenotypic age score.
What drives inflammaging:
- Excess body fat — especially belly fat
- Poor diet, high in sugar and processed foods
- Physical inactivity
- Chronic stress
- Poor sleep
- Smoking and alcohol
Diet and Biological Age
Food is the most powerful tool you have for changing your biological age. What you eat directly affects your glucose levels, CRP, albumin, and almost every other biomarker in this calculator.
Research consistently shows that people who eat diets high in vegetables, fruits, whole grains, and lean protein have lower biological ages than those eating processed, high-sugar diets.
Exercise and Biological Age
Regular physical activity reduces inflammation, improves insulin sensitivity, lowers glucose, and supports healthy organ function, all of which lower phenotypic age. Studies show that regular exercisers have biological ages 3 to 10 years lower than sedentary people of the same chronological age.
Both cardiovascular exercise and resistance training contribute. The combination of both produces the best results for biological age reduction.
Sleep and Aging
Poor sleep accelerates biological aging faster than most people realize. During sleep, your body:
- Repairs damaged DNA
- Clears inflammatory proteins from the brain
- Regulates blood sugar
- Produces growth hormone for cellular repair
Chronic sleep deprivation raises CRP, increases glucose, and disrupts white blood cell counts — all in the direction of higher biological age. Research links consistently sleeping under 6 hours per night with biological ages 3 to 5 years higher than those of adequate sleepers.
Stress and Biological Age
Chronic psychological stress raises cortisol, your body’s main stress hormone. Elevated cortisol over long periods:
- Raises blood glucose
- Suppresses the immune system
- Increases systemic inflammation
- Accelerates cellular aging through telomere shortening
Telomere length, the protective caps on your DNA, shortens faster under chronic stress. Shorter telomeres are a core hallmark of biological aging.
Smoking and Biological Age
Smoking is one of the most powerful accelerators of biological aging known to science. It directly damages DNA, raises CRP dramatically, reduces lymphocyte effectiveness, and stresses liver function. Studies show smokers have biological ages 5 to 10 years higher than non-smokers of the same chronological age on average.
Alcohol and Aging
Heavy alcohol consumption raises alkaline phosphatase (liver stress), increases inflammation, disrupts blood sugar, and reduces albumin production. Moderate drinking shows smaller effects — but no level of alcohol consumption improves biological age.
Obesity and Age Acceleration
Excess body fat, particularly visceral fat around the organs, is a constant source of inflammatory chemicals. This chronic inflammation directly raises CRP, disrupts glucose metabolism, and accelerates every aspect of biological aging. Obesity is consistently associated with biological ages 5 to 15 years higher than those of healthy-weight individuals.
How to Lower Your Biological Age
The most important message from aging research is this: your biological age is changeable. Here is what the evidence supports.
Mediterranean Diet and Longevity
The Mediterranean diet is the most researched dietary pattern for longevity and biological age reduction. It features:
- Olive oil is the primary fat
- Abundant vegetables and fruits
- Whole grains and legumes
- Fish at least twice per week
- Very little red meat or processed food
- Moderate red wine (optional)
Studies show that consistent Mediterranean diet adherence lowers CRP, improves glucose, raises albumin, and reduces biological age meaningfully over 6–12 months.
Intermittent Fasting and Biological Age
Intermittent fasting, eating within a restricted time window each day, shows promising effects on biological aging markers. The most common protocol is 16:8, eating within an 8-hour window and fasting for 16 hours.
Research shows intermittent fasting reduces glucose, lowers inflammation, and improves multiple blood biomarkers that feed into phenotypic age. Some studies suggest it can reduce biological age by 1 to 3 years over 6 months.
Caloric Restriction and Aging Research
Caloric restriction, eating fewer calories than usual without malnutrition, is one of the most consistent interventions for slowing biological aging in research. The CALERIE study, the first controlled trial of caloric restriction in humans, showed that modest caloric restriction (14% reduction) measurably slowed aging pace over 2 years.
However, caloric restriction requires careful management to avoid losing muscle mass alongside fat.
Exercise Protocol for Biological Age Reversal
The most effective exercise protocol for reducing biological age combines:
| Exercise Type | Frequency | Biological Age Benefit |
|---|---|---|
| Resistance training | 3x per week | Lowers glucose, reduces inflammation |
| Zone 2 cardio (moderate pace) | 3x per week | Improves cardiovascular markers |
| High intensity intervals | 1–2x per week | Metabolic and immune benefits |
| Daily walking | Daily | Lowers baseline inflammation |
Research from the Mayo Clinic found that high-intensity interval training reversed cellular aging markers in older adults by up to several years over 12 weeks.
Sleep Optimization for Healthy Aging
Target 7–9 hours of quality sleep per night. Practical strategies:
- Keep a consistent sleep and wake time, even on weekends
- Keep your bedroom cool (around 65–68°F / 18–20°C)
- Avoid screens for 1 hour before bed
- Avoid caffeine after 2 pm
- Avoid alcohol within 3 hours of bedtime
Stress Reduction Techniques
- Mindfulness meditation, even 10 minutes daily, lowers cortisol meaningfully
- Regular nature exposure shown to reduce inflammation markers
- Social connection loneliness raises biological age; strong relationships lower it
- Breathwork, slow, controlled breathing, activates the parasympathetic nervous system
- Riboside has shown promising results in early human trials for slowing biological aging markers.
Biological Age Calculator Comparison
Not all biological age calculators are equal. Here is how the main options compare.
Biological Age Calculator by Blood Test
Blood test-based calculators, like this one, are the most scientifically validated option available to the general public. They use objective, measurable data from your body rather than self-reported lifestyle information.
This makes them significantly more accurate than questionnaire or weight-based tools.
Biological Age Calculator by Weight and BMI
These tools use your height, weight, BMI, and sometimes basic lifestyle questions to estimate biological age. They are fast and require no blood tests. However, they are rough estimates — someone can have a perfect BMI but significantly elevated inflammation and aging markers that these tools miss entirely.
Biological Age Calculator AI Tools
Several new AI-powered tools claim to estimate biological age from photos, voice samples, or detailed questionnaires. These are interesting but not yet validated by peer-reviewed research to the same standard as blood-based phenotypic age. Use them as supplementary information — not as primary assessments.
Biological Age Calculator NHS Options
The UK National Health Service (NHS) does not currently offer a standardized biological age calculator as part of routine care. However, NHS blood tests cover most of the biomarkers needed for phenotypic age calculation. If you have NHS blood test results, you can enter them into this calculator directly.
Yale Biological Age Calculator
The Yale biological age calculator refers to the phenotypic age calculation developed by Dr. Morgan Levine during her time at Yale University. This calculator uses the same formula. There is no separate “official” Yale calculator available to the public; the formula itself is what this tool implements.
Free vs Paid Biological Age Tests
| Option | Cost | What You Get |
|---|---|---|
| This calculator | Free | Phenotypic age from your existing blood results |
| Private blood test + this calculator | $30–$100 | Full phenotypic age with fresh results |
| Direct-to-consumer aging test | $100–$300 | Phenotypic age with guided interpretation |
| Epigenetic clock test | $300–$500+ | DNA methylation age — most accurate |
| Full longevity clinic panel | $500–$2,000+ | Comprehensive aging assessment |
Biological Age Calculator App Options
Several apps offer biological age tracking, including MyFitnessPal integrations, InsideTracker, and Viome. Most use questionnaire data or require their own blood test kits. None currently implements the Levine phenotypic age formula as precisely as a dedicated calculator tool.
Which Biological Age Calculator Is Most Accurate?
For practical, accessible use, blood-test-based phenotypic age (this tool) is the most accurate option. For research-grade precision, epigenetic clocks (Horvath, GrimAge, DunedinPACE) are more accurate but cost significantly more. For rough estimates only: weight and lifestyle calculators provide a starting point but should not be relied on for health decisions.
How to Get a Blood Test for Biological Age
You need 9 specific blood values to use this calculator. Here is exactly how to get them.
What to Ask Your Doctor
At your next appointment, ask your doctor for:
- A Complete Blood Count (CBC): This gives you lymphocyte %, MCV, RDW, and WBC
- A Comprehensive Metabolic Panel (CMP): This gives you albumin, creatinine, glucose, and alkaline phosphatase
- A high-sensitivity CRP test: This is sometimes not included in standard panels, so ask specifically
Most doctors order these tests routinely for annual checkups. If they ask why, you can simply say you want a comprehensive baseline health assessment.
Private Blood Test Options
If you do not have a doctor or want to test independently:
- Quest Diagnostics, US-based, offers walk-in testing available
- LabCorp, US-based, direct-to-consumer options
- Medichecks, UK-based, offers comprehensive panels available online
- Thriva, UK-based, home testing kits
- Any private GP or clinic can order all the required tests
At-Home Blood Test Kits
Several companies now offer finger-prick blood tests that you do at home and mail to a lab. Results arrive within a few days. Quality varies; look for services that use accredited laboratories and provide all 9 required biomarkers.
What the Complete Blood Count (CBC) Includes
The CBC is a standard test that measures the cells in your blood. From this calculator’s perspective, it provides:
- Lymphocyte percentage
- Mean Cell Volume (MCV)
- Red Cell Distribution Width (RDW)
- White Blood Cell count
What the Comprehensive Metabolic Panel Includes
The CMP tests the chemistry of your blood, particularly organ function and nutrient levels. It provides:
- Albumin
- Creatinine
- Glucose
- Alkaline Phosphatase
The CRP test is separate from both panels. Always request it specifically.
How Often Should You Test?
| Situation | Recommended Frequency |
|---|---|
| Healthy baseline tracking | Once per year |
| Active lifestyle intervention | Every 3–6 months |
| Managing a chronic health condition | As recommended by your doctor |
| After a major diet or lifestyle change | 3 months after the change |
Testing more frequently than every 3 months rarely yields useful additional information, biological age changes slowly, and short-term fluctuations in individual biomarkers can lead to misleading results.
Limitations of This Calculator
Every tool has limits. Here is what this one cannot do, and when to seek additional help.
What This Tool Cannot Tell You
- It cannot diagnose any disease or medical condition
- It cannot replace a clinical assessment by a healthcare professional
- It cannot account for medications that affect blood values
- It cannot measure epigenetic age, which requires DNA testing
- It cannot predict your exact lifespan
- It cannot account for acute illness at the time of testing
Why Results Vary Between Tests
Your blood values fluctuate based on many short-term factors:
- Recent infections dramatically raise CRP and WBC
- Recent intense exercise temporarily raises creatinine and WBC
- Dehydration concentrates blood values and skews results
- Non-fasting state glucose values must be fasting for accuracy
- Recent alcohol affects liver markers and glucose
- Time of day, some values vary across the day
- Stress can temporarily raise glucose and WBC levels
Always use fasting blood test results taken when you are healthy and well-rested for the most accurate biological age calculation.
When to See a Doctor About Your Results
See a doctor if:
- Your biological age is more than 10 years above your chronological age
- Any individual biomarker is significantly outside the normal range shown on your lab report
- Your CRP is above 10 mg/L — this suggests active inflammation or infection
- Your albumin is below 3.0 g/dL — this is clinically significant
- Your glucose is above 126 mg/dL fasting — this may indicate diabetes
- Your WBC is above 11,000 or below 4,000 — both warrant investigation
Frequently Asked Questions
Enter your date of birth, date of blood test, and 9 blood values, albumin, creatinine, glucose, CRP, lymphocyte %, MCV, RDW, alkaline phosphatase, and white blood cells, into this calculator. It applies the Levine phenotypic age formula and returns your estimated biological age instantly.
Yes — if you have blood test results. Enter your values into this free calculator for an instant result. Alternatively, order an at-home blood test kit. Your GP or doctor can also provide all required values through a standard annual blood panel.
The four types are: chronological age (years since birth), biological age (how old your body functions), functional age (physical and cognitive ability level), and psychological age (how old you feel and think). Biological age is the most measurable and most predictive of health outcomes.
Based on publicly reported physiological assessments, Cristiano Ronaldo’s biological age is estimated at around 23–25 years — roughly 15 years younger than his chronological age. This reflects his exceptional sleep, nutrition, training, and recovery habits maintained consistently over decades.
A normal biological age is within 1 to 3 years of your chronological age. Being 1 to 5 years younger is considered good. Being more than 5 years younger is excellent. Being more than 5 years older than your chronological age warrants a lifestyle review and possibly a medical consultation.
Yes — this calculator is completely free. No email address, no signup, and no payment is required. Enter your blood test values and get your result instantly.
You need a Complete Blood Count (CBC), a Comprehensive Metabolic Panel (CMP), and a high-sensitivity CRP test. Together, these provide all 9 biomarkers needed. Most annual health checkups already include CBC and CMP — ask specifically for CRP.
The Levine phenotypic age formula is highly accurate for predicting mortality risk and health outcomes at the population level. For individuals, it is a validated estimate — not an exact measurement. Using it consistently over time to track trends gives more value than any single result.
Yes — meaningfully. Research shows that consistent lifestyle changes — particularly diet, exercise, and sleep improvements — can reduce biological age by several years within 6 to 12 months. The CALERIE study and multiple intervention trials have demonstrated this directly.
The Yale biological age calculator refers to the phenotypic age formula developed by Dr. Morgan Levine during her research at Yale University School of Medicine. This calculator implements that exact formula using your blood test results.
Metabolic age estimates how your metabolic rate compares to that of average people your age, usually based on body composition. Biological age measures overall cellular and organ aging using blood biomarkers. Biological age is more comprehensive and more scientifically validated than metabolic age.
The most accurate free biological age calculator uses the validated Levine phenotypic age formula with blood test inputs — which is exactly what this tool does. Weight or questionnaire-based free calculators are less accurate because they use no objective biological data.
Related Calculators
These tools pair naturally with the Biological Age Calculator:
- Life Expectancy Calculator — Estimate your projected lifespan based on health and lifestyle factors
- BMI Calculator — Calculate your Body Mass Index alongside your biological age
- Sarcopenia Risk Calculator — Assess muscle loss risk — a key component of functional age
- Grip Strength Calculator — Measure functional age through grip strength percentile
- Body Fat Percentage Calculator — Understand body composition beyond weight and BMI
- Frailty Index Calculator — Assess overall frailty risk — closely linked to biological age
- Metabolic Age Calculator — Compare metabolic function to your biological and chronological age
Important Safety Information
This calculator is provided for informational and educational purposes only. It explains how the Biological Age Calculator works and what your result means in the context of published research.
This tool is not medical advice. It does not diagnose any disease or health condition. It is not a substitute for professional medical evaluation. Do not use these results to start, stop, or change any medication or medical treatment.
Always consult a qualified healthcare professional before making changes to your diet, exercise routine, or supplement regimen — especially if you have an existing health condition or if any of your blood biomarkers fall outside normal ranges.
The phenotypic age formula is based on: Levine ME et al. “An epigenetic biomarker of aging for lifespan and healthspan.” Aging (Albany, NY). 2018 Apr 18;10(4):573-591.
Results are estimates based on population-level research. Individual variation means your result is a directional indicator — not a definitive measurement of your exact biological age.